This article is for Tempo for Data Center.
Step 1 – Enable Your IP Using Tempo Access Control
Step 1
JIRA administrators will need to start by enabling the IP address(es) of the machine(s) that will be able to access Tempo services. Admins can add IP addresses to the list of Allowed addresses using Tempo Access Control . Users' IP addresses must be included in the list in order to use the GetWorklogs function in the Tempo API . The Account Manager needs to be enabled with at least one Account configured.

The security token is also required, and must be included in the URL, as shown further below in this post.

Step 2 – Configure JIRA Custom Field(s) for Export
Step 2
If you would like to include JIRA custom fields to your XML export, you will need to select them from the Tempo Administration's Fields section, as shown below.

Step 3 – Define Your API String
Step 4 – Test Your API String in a Browser
Step 3
Test the string with format=xml in a browser to see if the service is returning your data. It should look something like the output below, and will potentially be quite long.
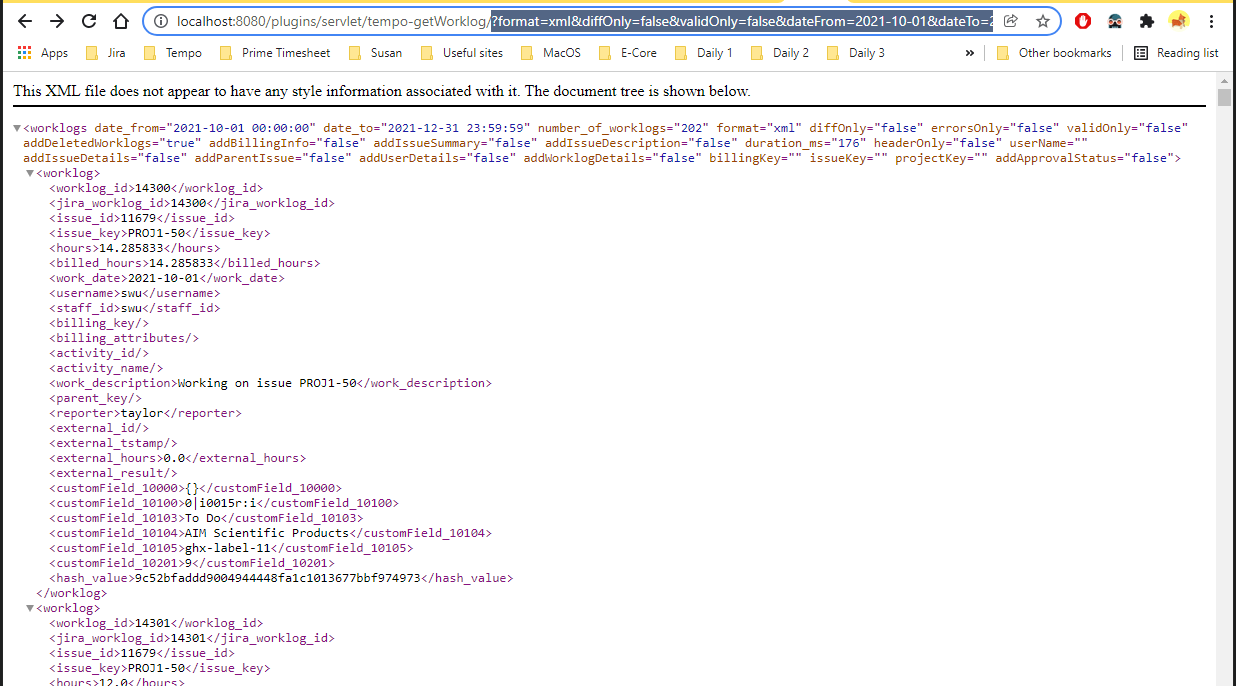
Once you’ve seen your data output, you can move on to the next step.
Step 5 – Import Your Data
Step 5
The examples below apply to Microsoft 365.
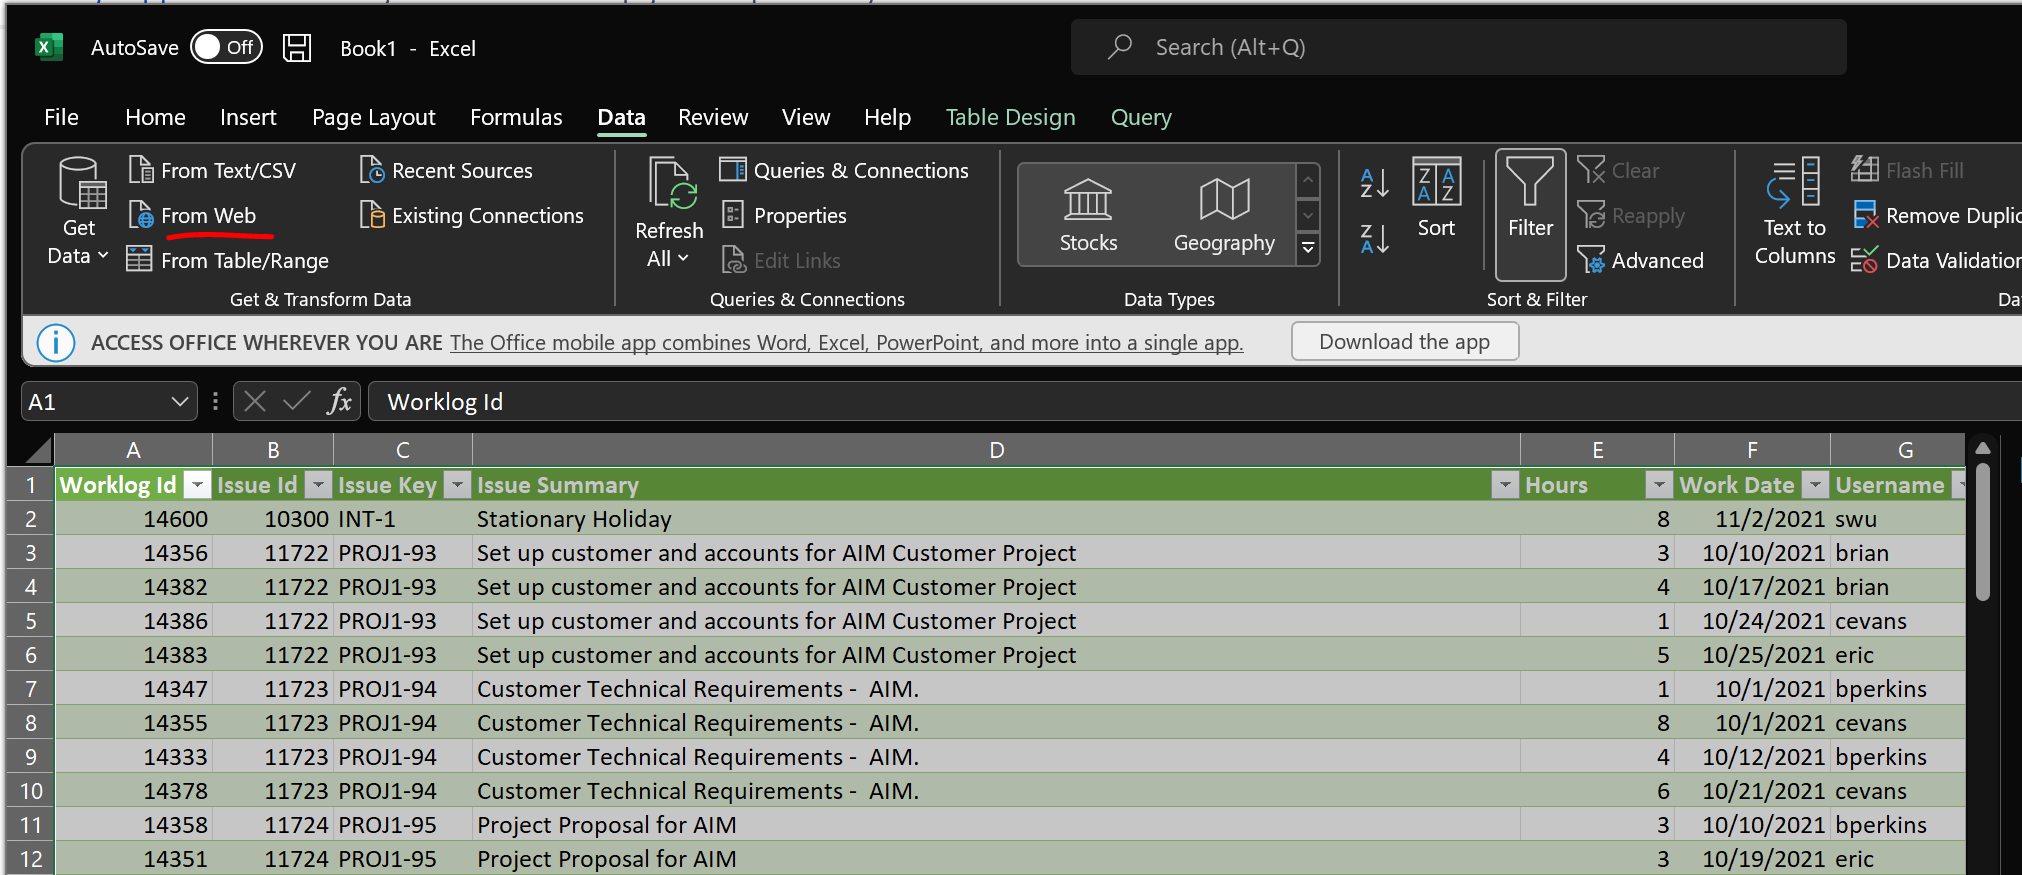
Open Microsoft Excel and click the Data tab. Then click the From Web button to import your data.
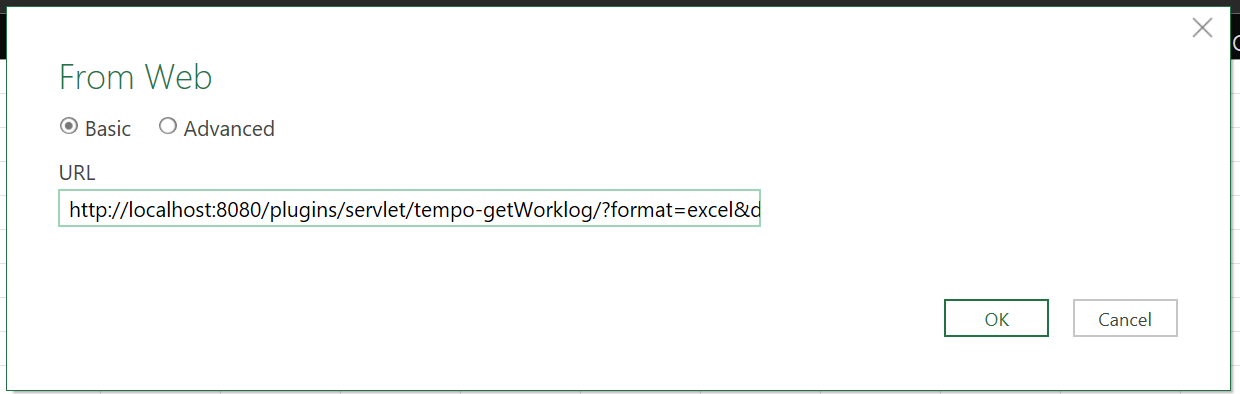
Paste your search URL to the URL field and click the OK button to display the Query in the New Web Query dialog.
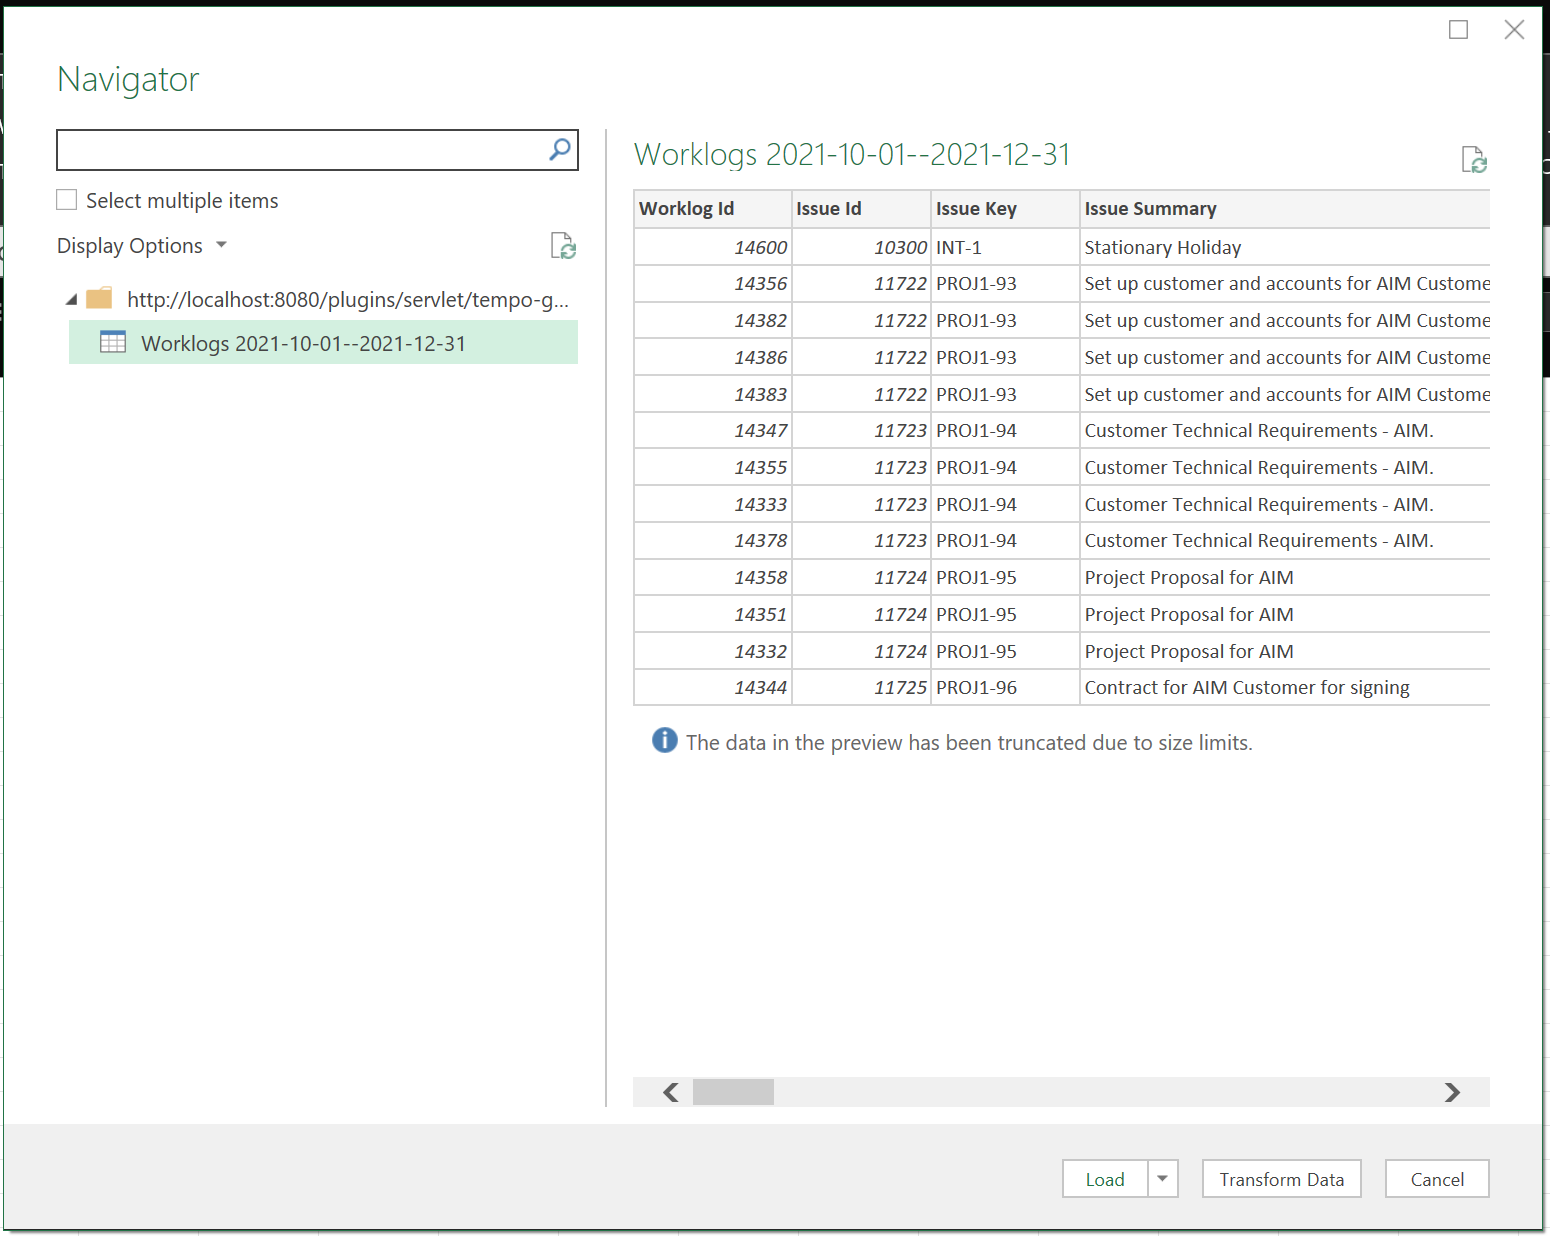
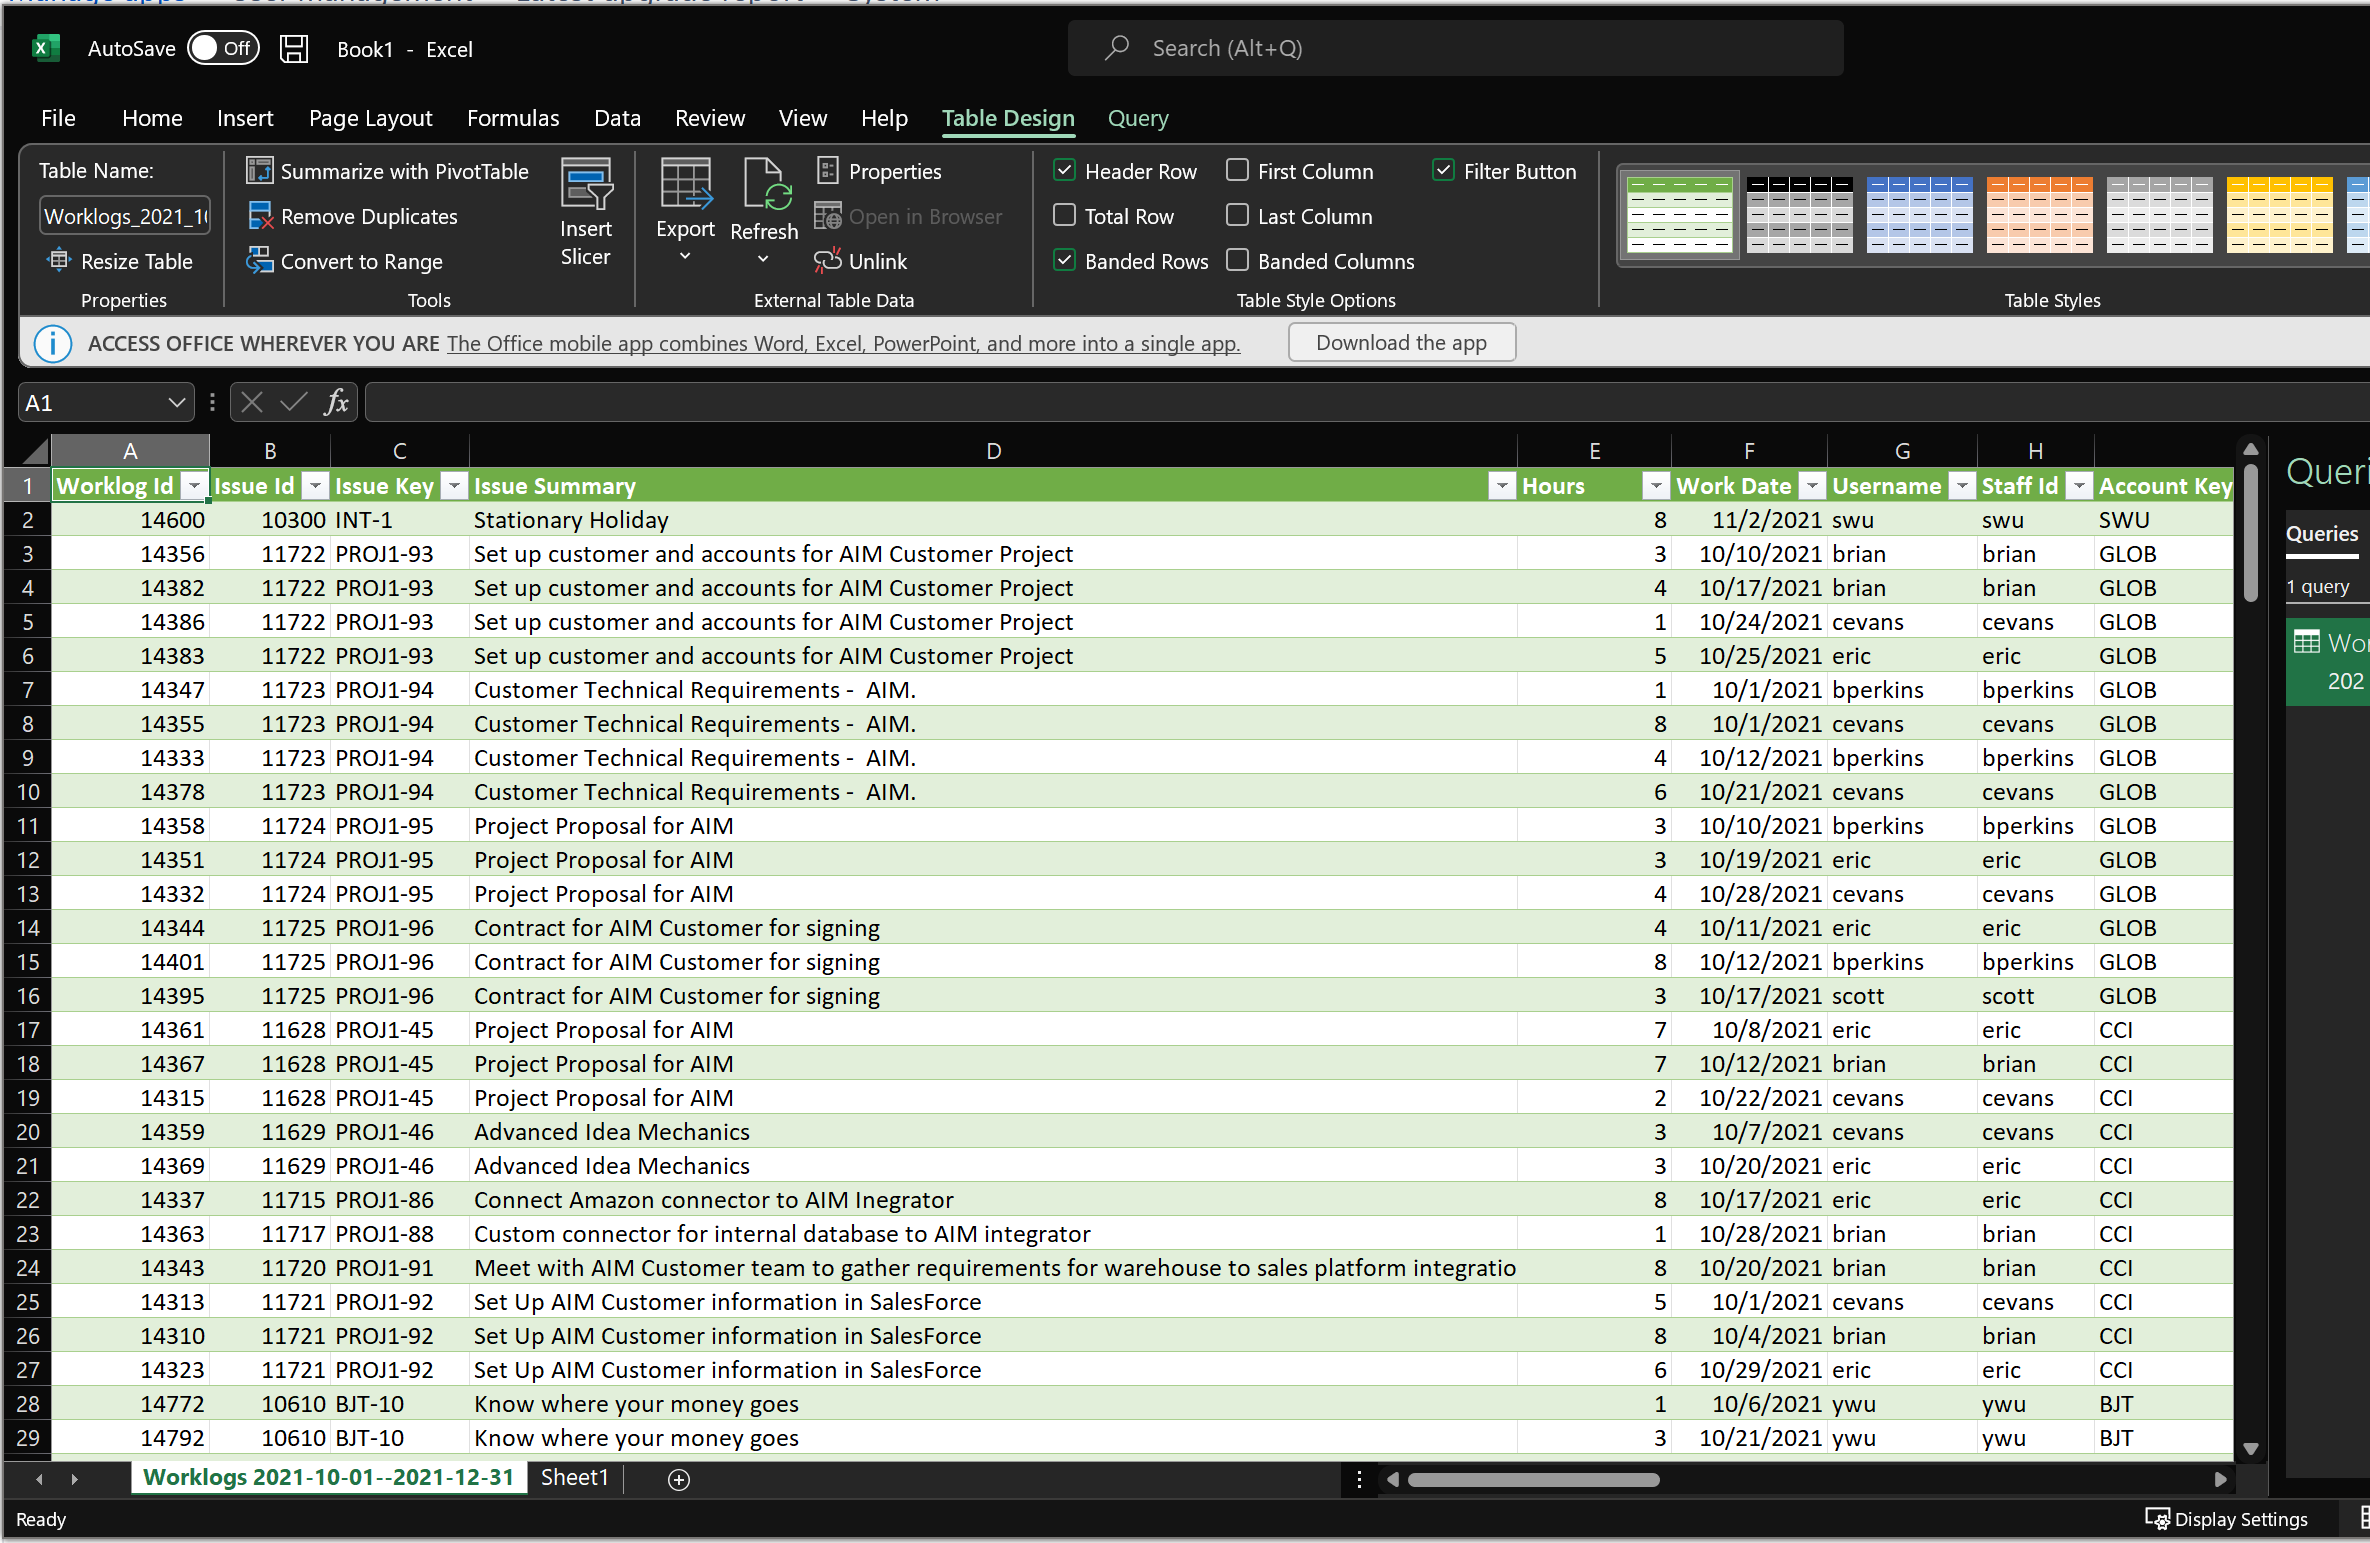
Click the Load button to import the data to Excel.
Your data should now be displayed in an Excel table. On this worksheet, you can summarize the data according to your needs by creating a PivotTable (see below).
Step 6 – Create a Customized PivotTable
Step 6
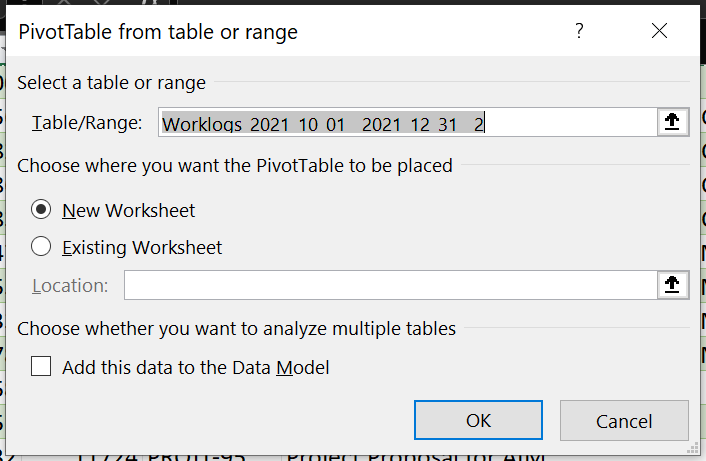
First, click the Summarize with PivotTable link.

Next, select your table or range in the PivoteTable from table or range dialog and then click the OK button.
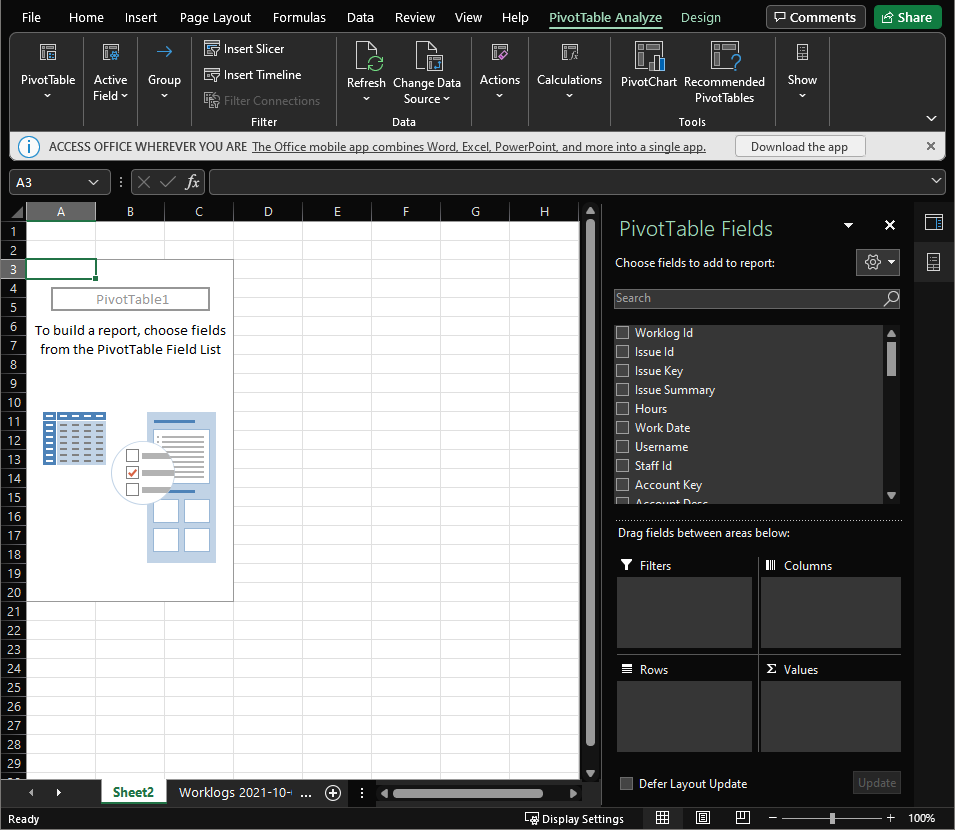
Select the fields you want from the PivotTable Fields.
Step 7 – Create Custom Reports and Views
Step 7
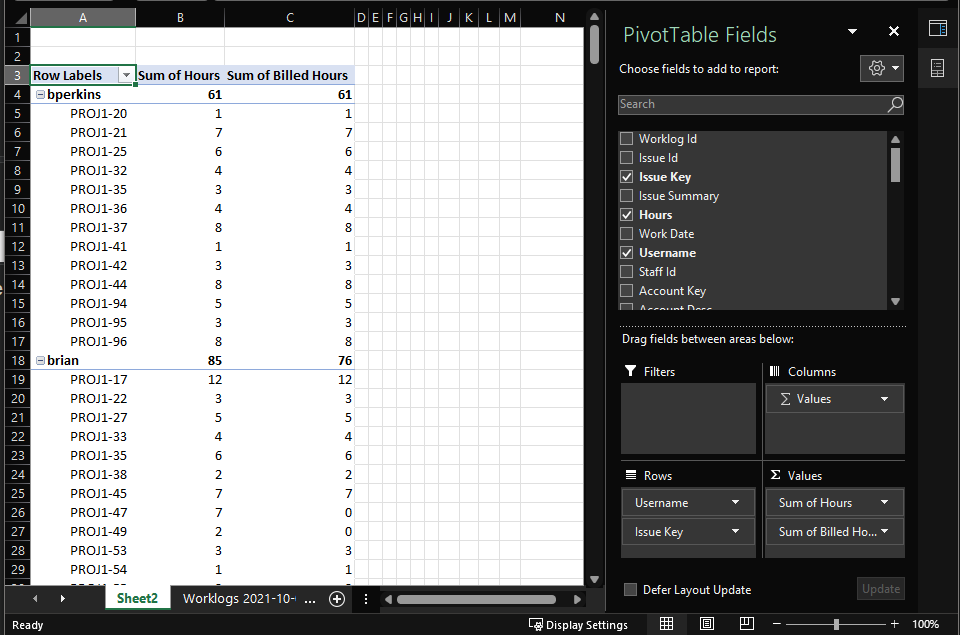
Now you can build your views, generate charts or graphs, and analyze your data. In the example below, 4 fields were selected from the PivotTable Field List: Hours, Billed Hours, User Name, and Issue Key.
![]()
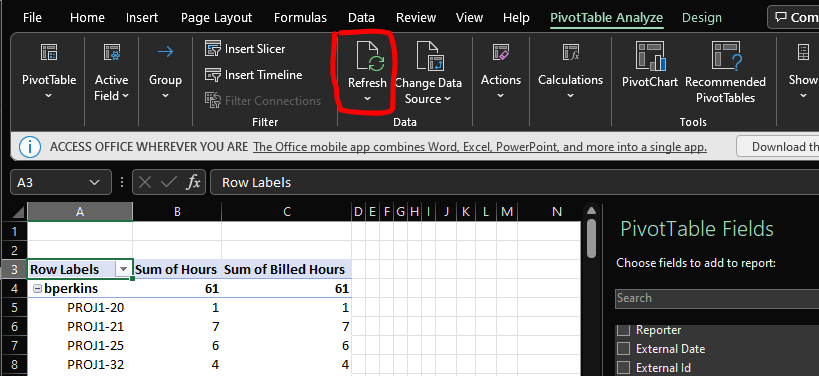
Step 8 – Refresh Your Data
You can refresh your data by clicking the Refresh All button. If you have selected specific dates, your report will always work within that specified date range.
Conclusion
Excel can provide an excellent overview of both JIRA and Tempo data. However, there may be some limitations, depending on the volume of data you are working with. We‘d love to hear from those of you who have discovered a solution for processing and analyzing large amounts of data, or are using other tools that provide similar results. Feel free to leave further questions and feedback below!