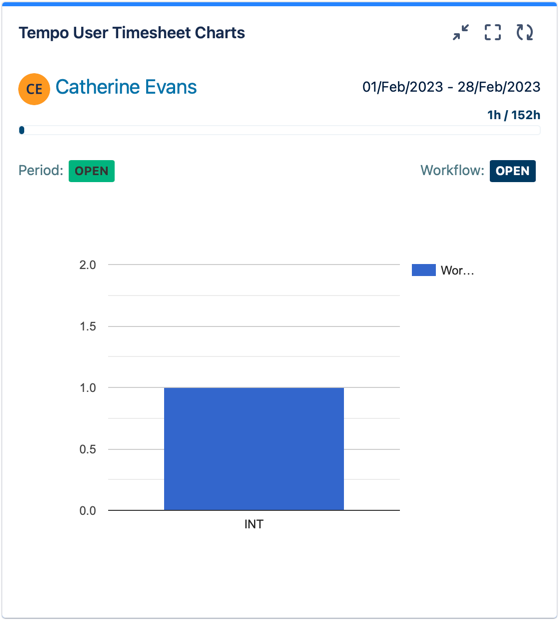
The User Timesheet Charts gadget shows your logged time for a current period. The data can be displayed using pie chart, column chart, or area chart.
For information about how to add the gadget to your Jira dashboard, see Tempo Gadgets .
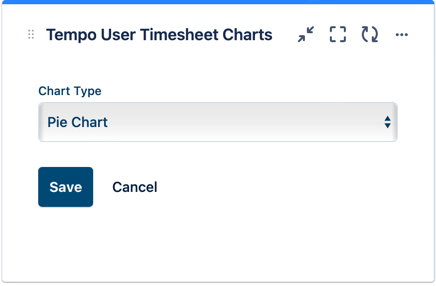
To configure the User Timesheet Charts gadget:
-
Go to your Jira dashboard and click … in the upper-right corner of the User Timesheet Charts gadget.
-
Select Edit.
-
Select the chart type in Display to illustrate the data in the most meaningful way to you.
-
Select how often you would like the date to be refreshed in Refresh Interval.
-
Click Save to display the results in a graph.
-
The gadget is displayed in the dashboard with the filtered criteria.