Work Metrics are located on the Edit Panel Properties tab. For increased visibility, set them as columns in Portfolio, Package or Project views and include them on Dashboards. Work Metrics can be exported from Grid Views for reporting and analysis.
|
1 |
|
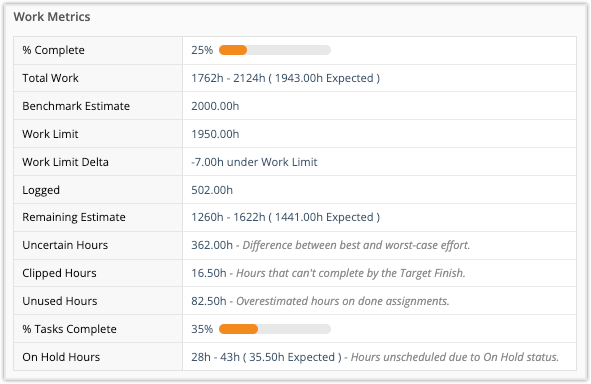
Work Metrics help you keep projects on track and stay up-to-date with your team’s progress. They’re located on the Edit Panel Properties tab and they can be set as columns in Priority and Grid views or displayed on Dashboards. Work Metrics calculate automatically based on hours logged and estimated. Work Limit is optional, and the Work Limit Delta field calculates when a limit is set. Learn more in the Work Limit lesson.
% Complete is the percentage of work completed so far, this is your progress toward completing Total Work.
Total Workshows how much is expected overall, from the equation, Logged + Remaining Estimate = Total Work.
Work Metrics for a Package, Project, or Sub-Folder are a roll up of scheduling data from all items in the container. They have an additional metric for % Tasks Complete which is the percentage of tasks completed so far, measuring progress toward marking everything “Done”.
|
2 |
|
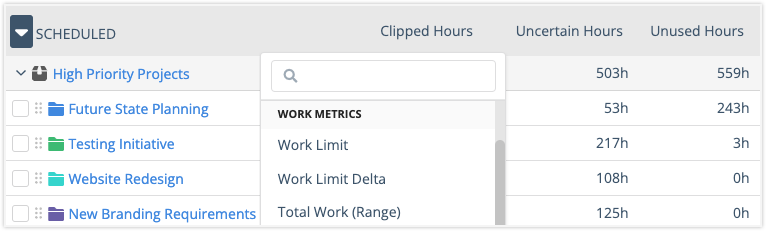
Set Work Metrics columns in Priority Views by clicking on the column header to select from the menu. Use the search bar to find a metric by name. Total Work and Remaining Estimate metrics can be represented four ways: as a range or with individual High/Low columns and as an Expected value which is the midpoint of the range.
|
Range: |
Total Work = 400h – 500h |
Remaining Estimate = 40h – 50h |
|
Low value: |
Total Work (Low) = 400h |
Remaining Estimate (Low) = 40h |
|
High value: |
Total work (High) = 500h |
Remaining Estimate (High) = 50h |
|
Expected: |
Total Work E = 450h |
Remaining Estimate E = 45h |
|
3 |
|
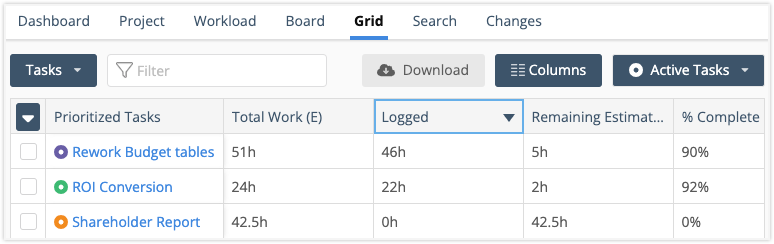
Display Work Metric columns in Portfolio, Package or Project Grid Views. Use the drop down menu in the upper left corner to select the hierarchy focus and view metrics by Package, Project, Sub-Folder, Task or Assignment.
Use the Columns button to update columns and change their order.
Click on a column header to sort column metrics.
Downloadto Excel for further analysis.
Learn more in the Grid View Lesson.
|
4 |
|
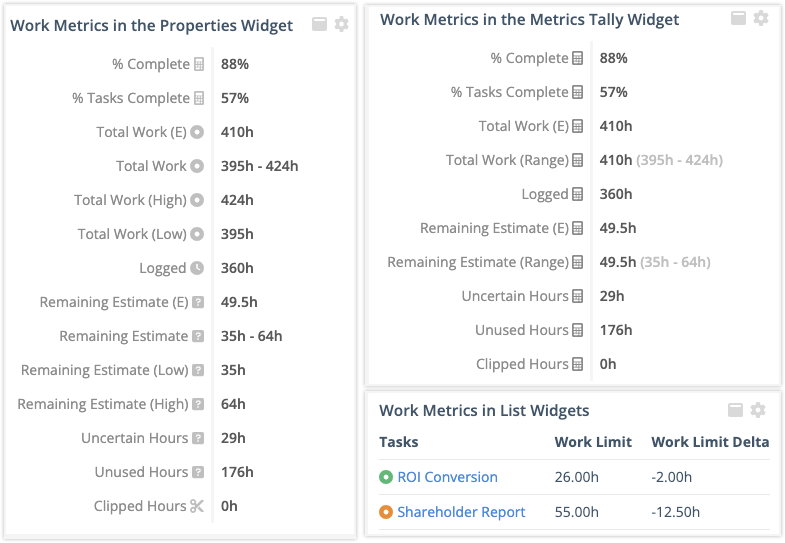
Monitor Work Metrics in real time on a Dashboard using Properties and Metrics Tally widgets or set up List widgets to see metrics by plan item. In a List widget, you select columns to display on the widget in View Mode and set up additional columns for the Grid View that expands when the List widget is clicked.
See Dashboards to learn about Dashboard settings and widgets.