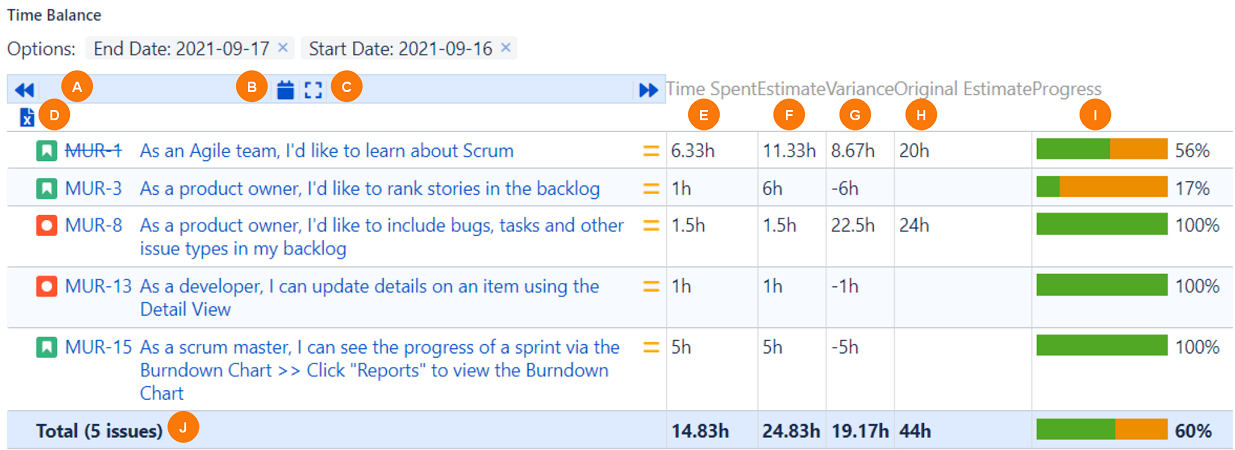
The Time Balance report for Jira Server and Data Center displays all time tracking changes for issues in a set period. Note that there is no access to worklogs from this report page.
|
Element |
What is it? |
What can I do with it? |
|---|---|---|
|
A |
Previous and Next icons |
Click to scroll to the previous or next week. |
|
B |
Worked Hours icon |
Select whether to display the daily, weekly, or monthly worked hours. |
|
C |
Details icon |
Select whether to show or hide every worklog. When set to Hide, entries are grouped by issue. |
|
D |
Download icon |
Click to export the report. See Exporting and Importing Time Reports . |
|
E |
Time Spent column |
Displays the sum of worklogs for an issue, during the period selected. Note, there is also a Jira issue Timespent field, which is the overall value of time logged for an issue. |
|
F |
Estimate column |
Displays Time Spent + Est. Time Remaining. |
|
G |
Variance column |
Displays the time variance, calculated as Original Estimate - Estimate (Time Spent + Est. Time Remaining). |
|
H |
Original Estimate column |
Displays the initial estimated time specified in the issue field. |
|
I |
Progress Column |
Displays a progress bar for a quick visual cue of the progress per issue. Calculated as Time Spent / ( Est. Time Remaining + Time Spent). Displays as 100% when Est. Time Remaining is 0. |
|
J |
Total row |
Displays the total time per time column, as well as the total progress for the displayed table. |