Jira Service Management customers can visualize and manage SLA fields within a structure. This makes it possible to create custom views into your support queue and view SLA values alongside any other project or work item data.
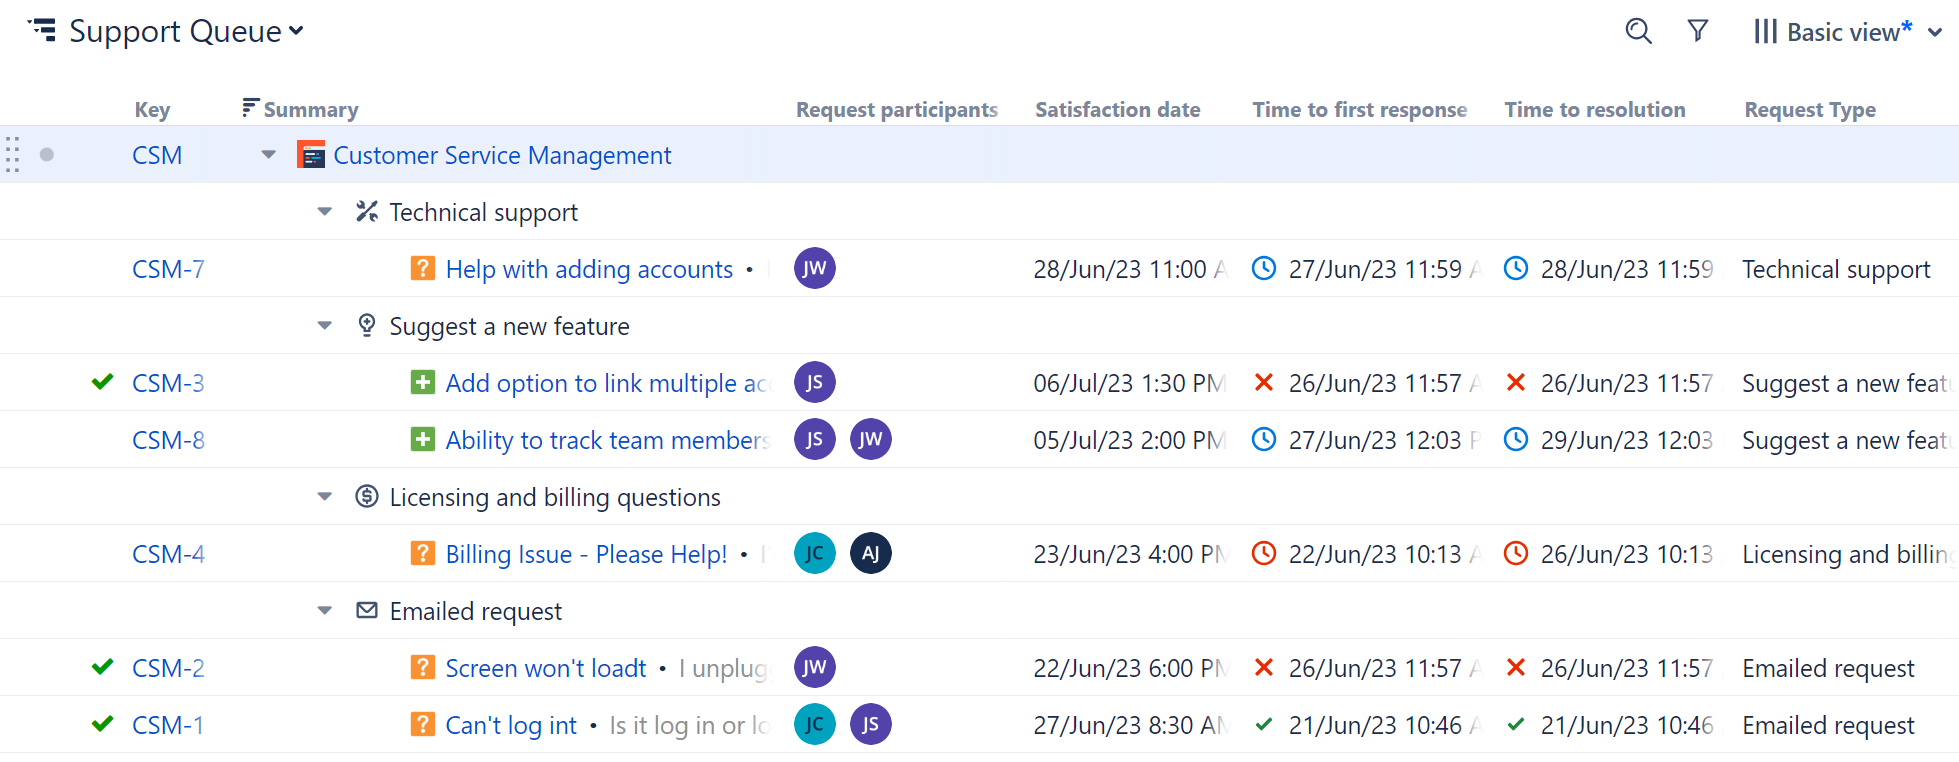
The following Service Management columns are available in Structure:
-
Request participants
-
Request type
-
Satisfaction date
-
Time to close after resolution
-
Time to first response
-
Time to resolution
-
Time to review normal change
You can also group service work items by the Request Participants and Request Type fields.
If SLA times don't reflect your current time zone, try updating your time zone settings: click your profile icon, select Manage Account, and under Local Time set the "Who can see this?" value to Anyone.
Currently, "Time to..." fields cannot be sorted or used in formulas. Request Participants, Request Type, and Satisfaction Date fields can be sorted and used in formulas.
Additional Information
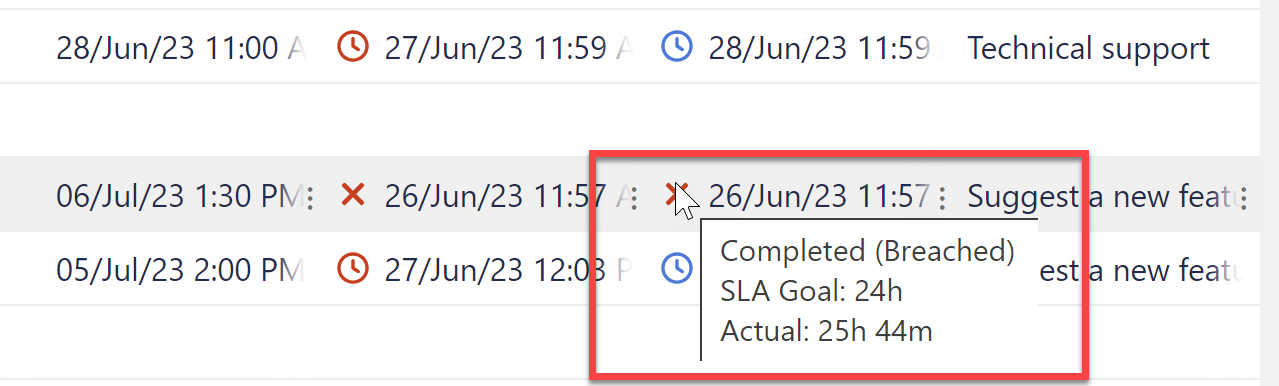
"Time to..." columns include icons which provide at-a-glance information about each ticket's timeline and SLAs:


You can view additional information by hovering over the field value.