Custom Charts makes it easy to build customized dashboard reports, charts, graphs, and more. By combining Structure and Custom Charts , you can build custom reports to cover your work, your projects, or even your entire portfolio.
Build Custom Charts for a Structure
To build custom charts based on a structure:
-
Make sure Structure and Custom Charts for Jira are installed.
-
From the Jira Dashboard editor screen, click Add gadget and search for Custom Charts. Select the first gadget from the list: Custom Charts.
-
In the newly created gadget, open the Source dropdown and select Structure.
-
Select the structure or structures you want to use for your chart. The resulting chart will be based on all the work items in the selected structure(s).
-
Customize your chart. For more information, see Build your first Custom Chart .
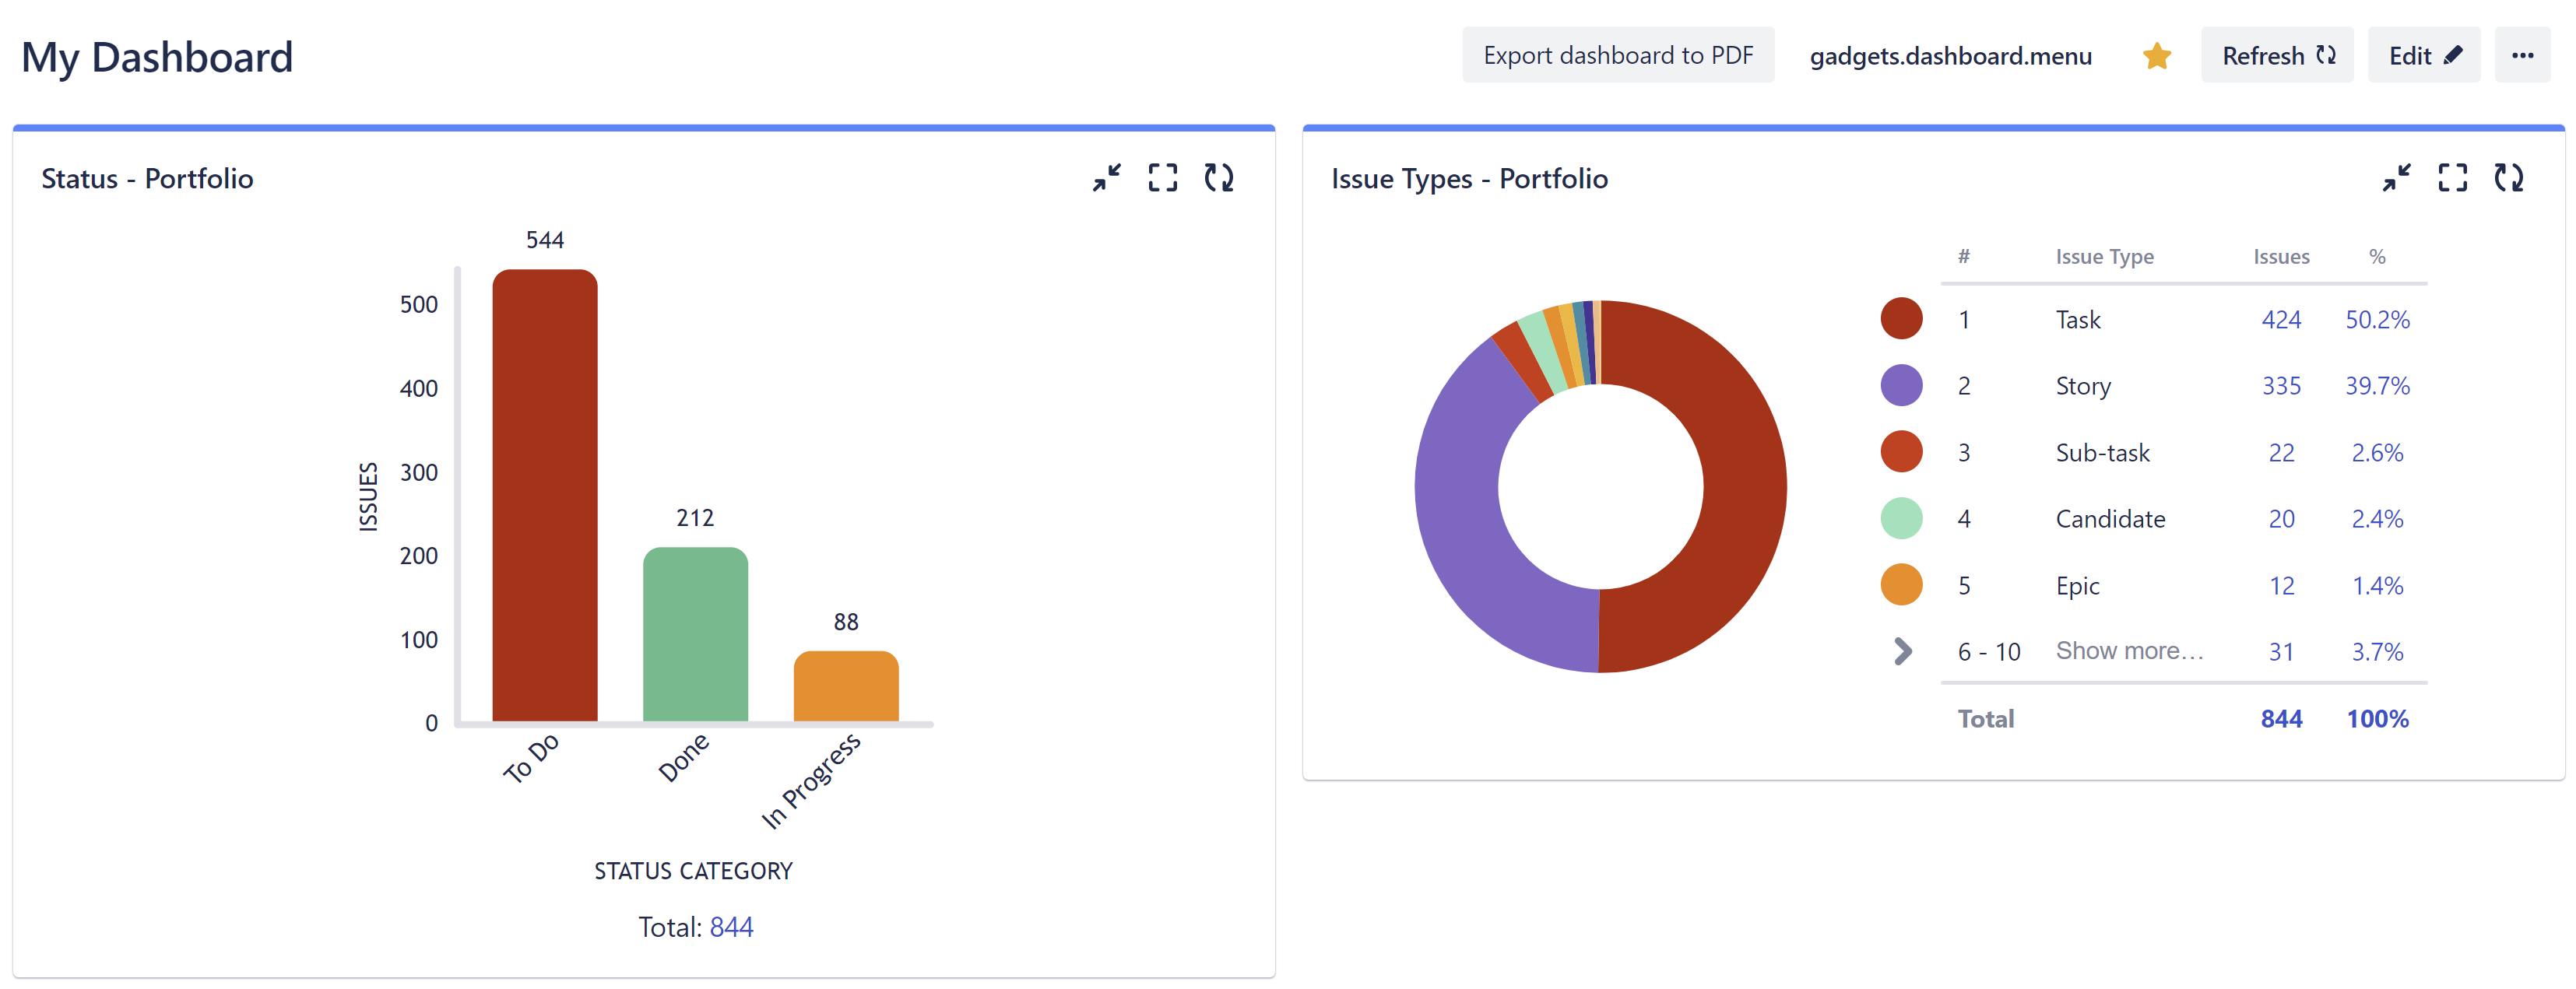
Reporting for Your Entire Portfolio
Adding Custom Charts for Jira to your Strategic Portfolio Management solution lets you build custom reports to track your entire portfolio - or even just your piece of it.
To create reports for your entire portfolio, use the structure integrated with your Strategic Roadmaps roadmap .
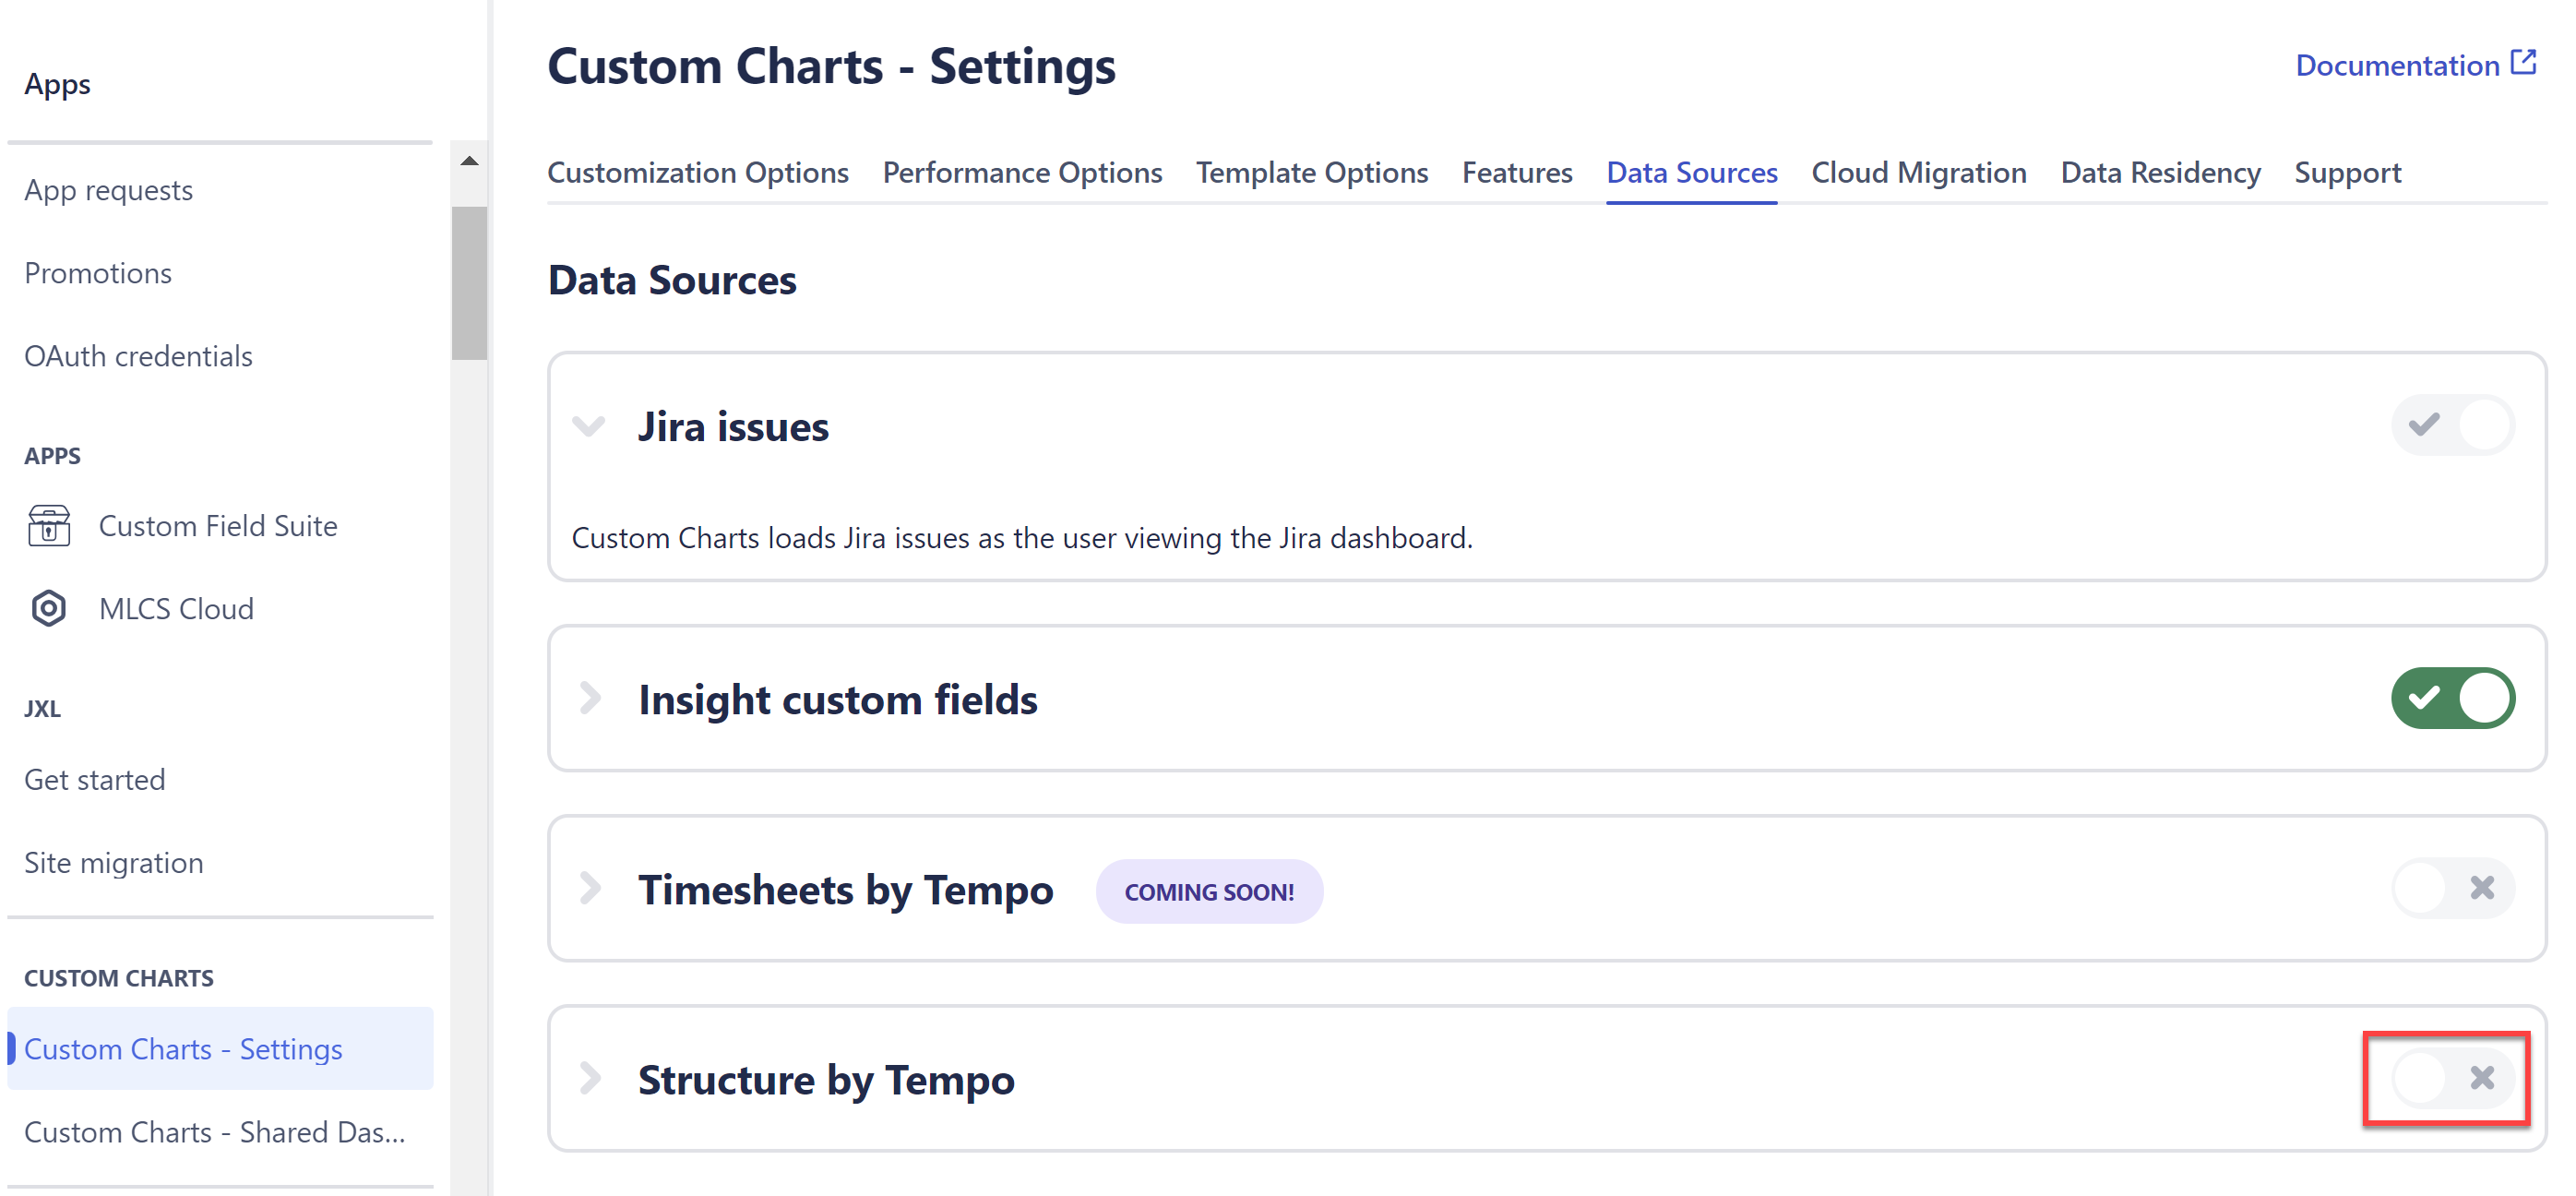
Enable Structure as a Data Source
If you aren't able to select Structure in the Source menu, ask your Jira Admin to enable Structure as a data source for Custom Charts.
To do this, go to Settings | Apps | Custom Charts | Data Sources and enable Structure.