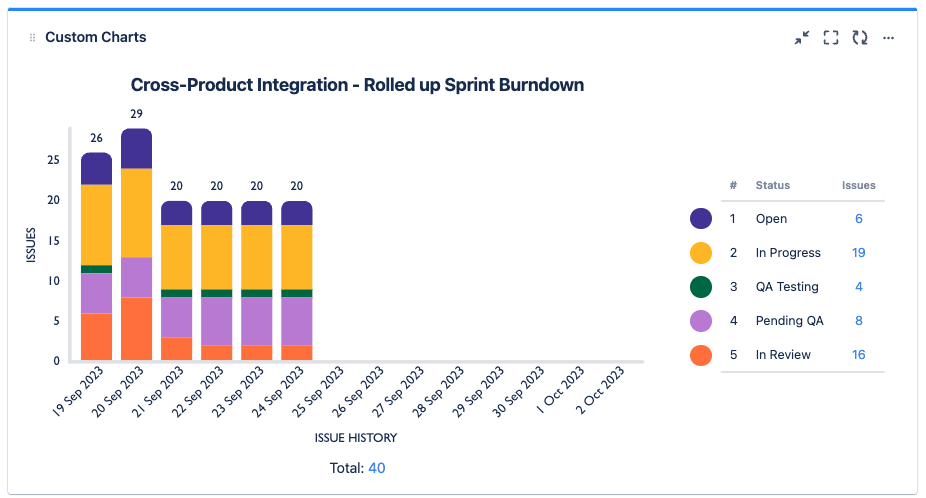
Track your project in Structure, and then create a burndown chart using our Custom Charts integration.
The following guide requires Custom Charts for Jira . If you don't have Custom Charts, you can try it for free .
Build Your Structure
If you already have a structure for your project, skip ahead to step two. If not, the following resources can help:
-
Building a Structure in Speed Mode
-
Building a Structure with Generators
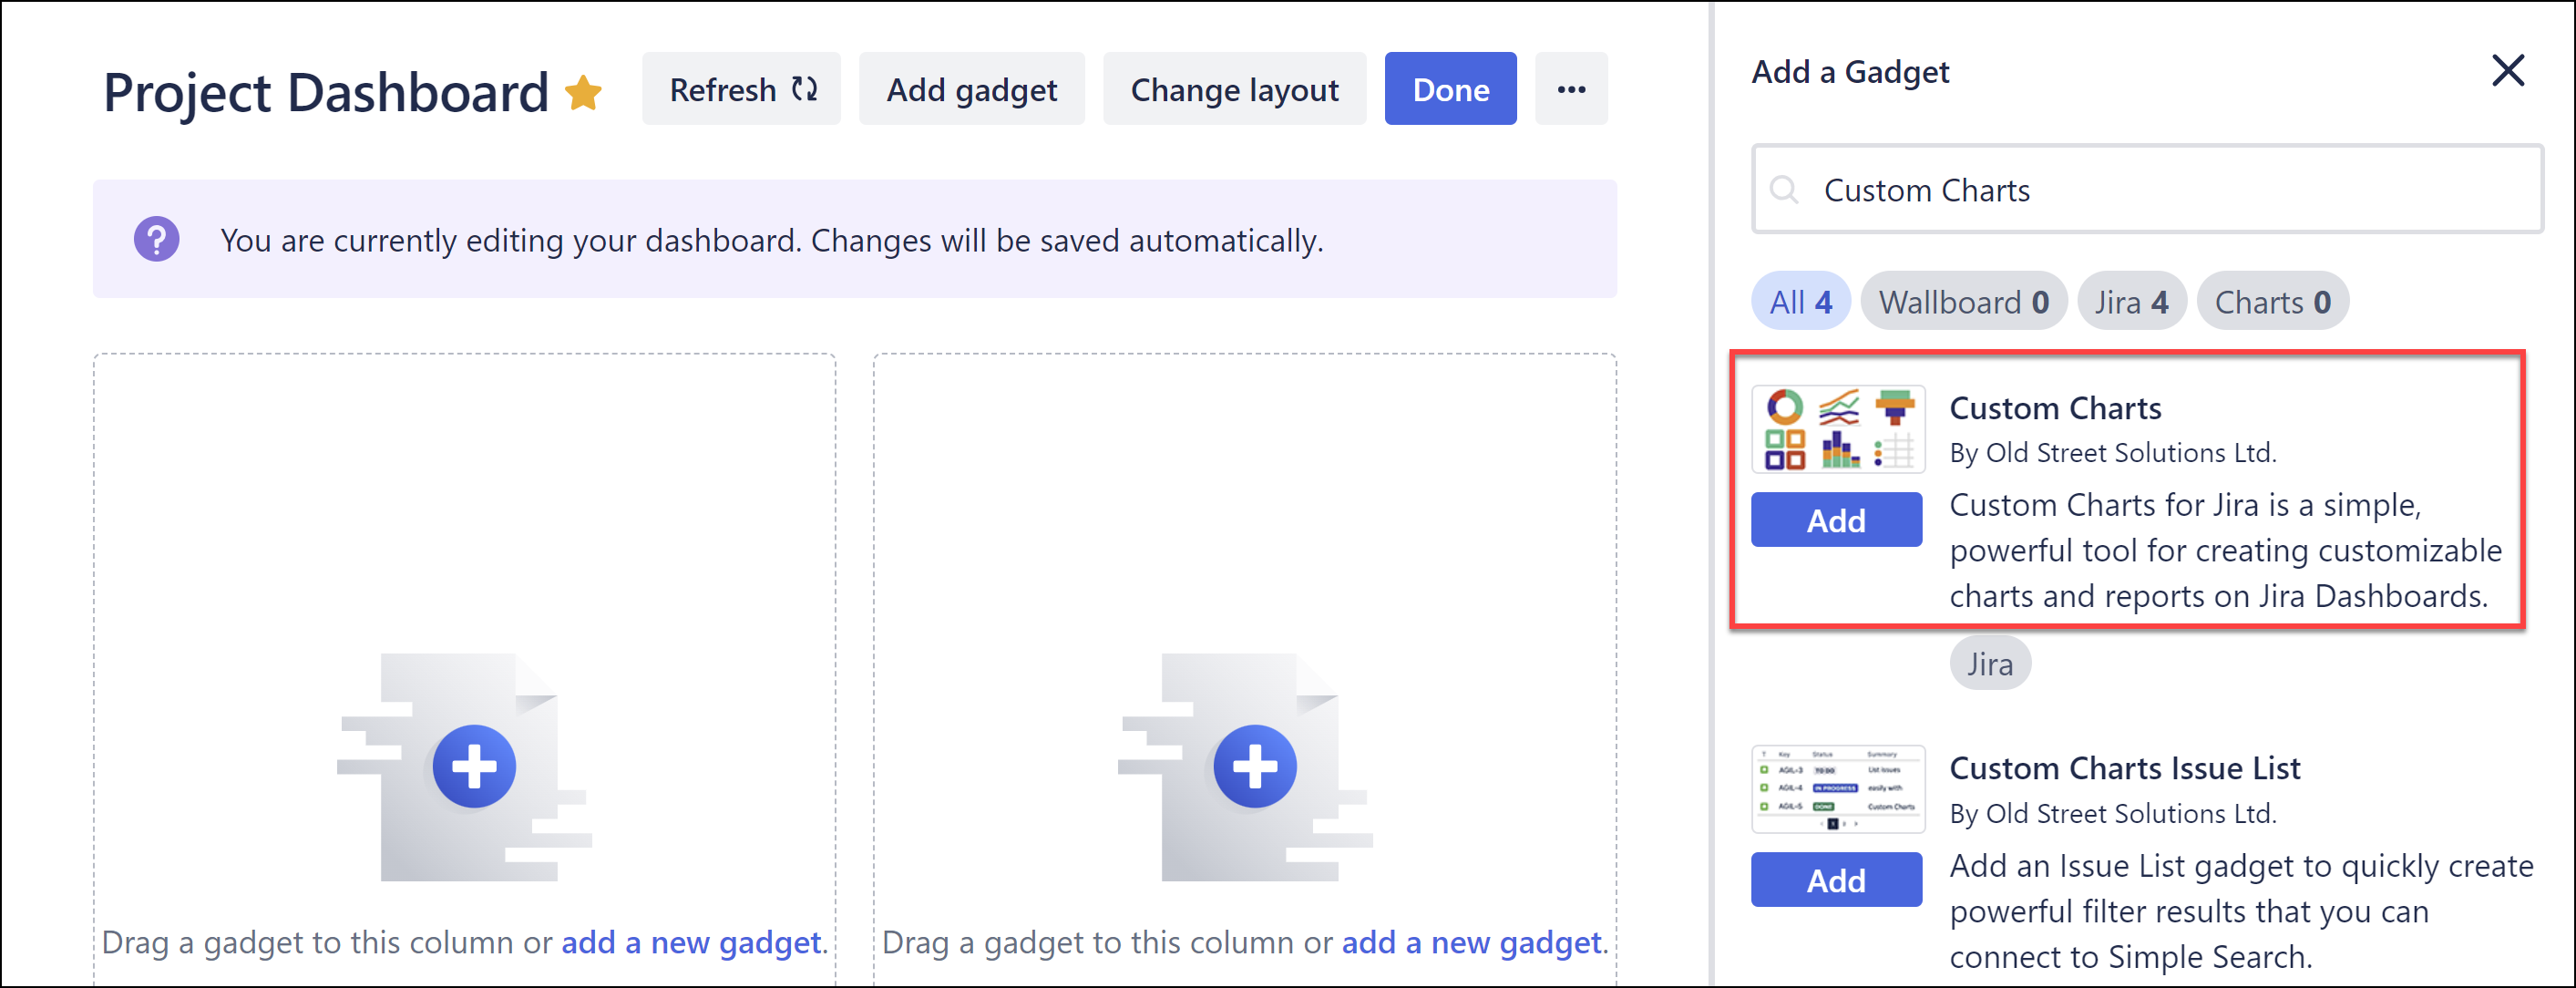
Add a Custom Chart to the Dashboard
-
Open your dashboard (or create a new one).
-
Select add a new gadget and search for Custom Charts in the gadget list.
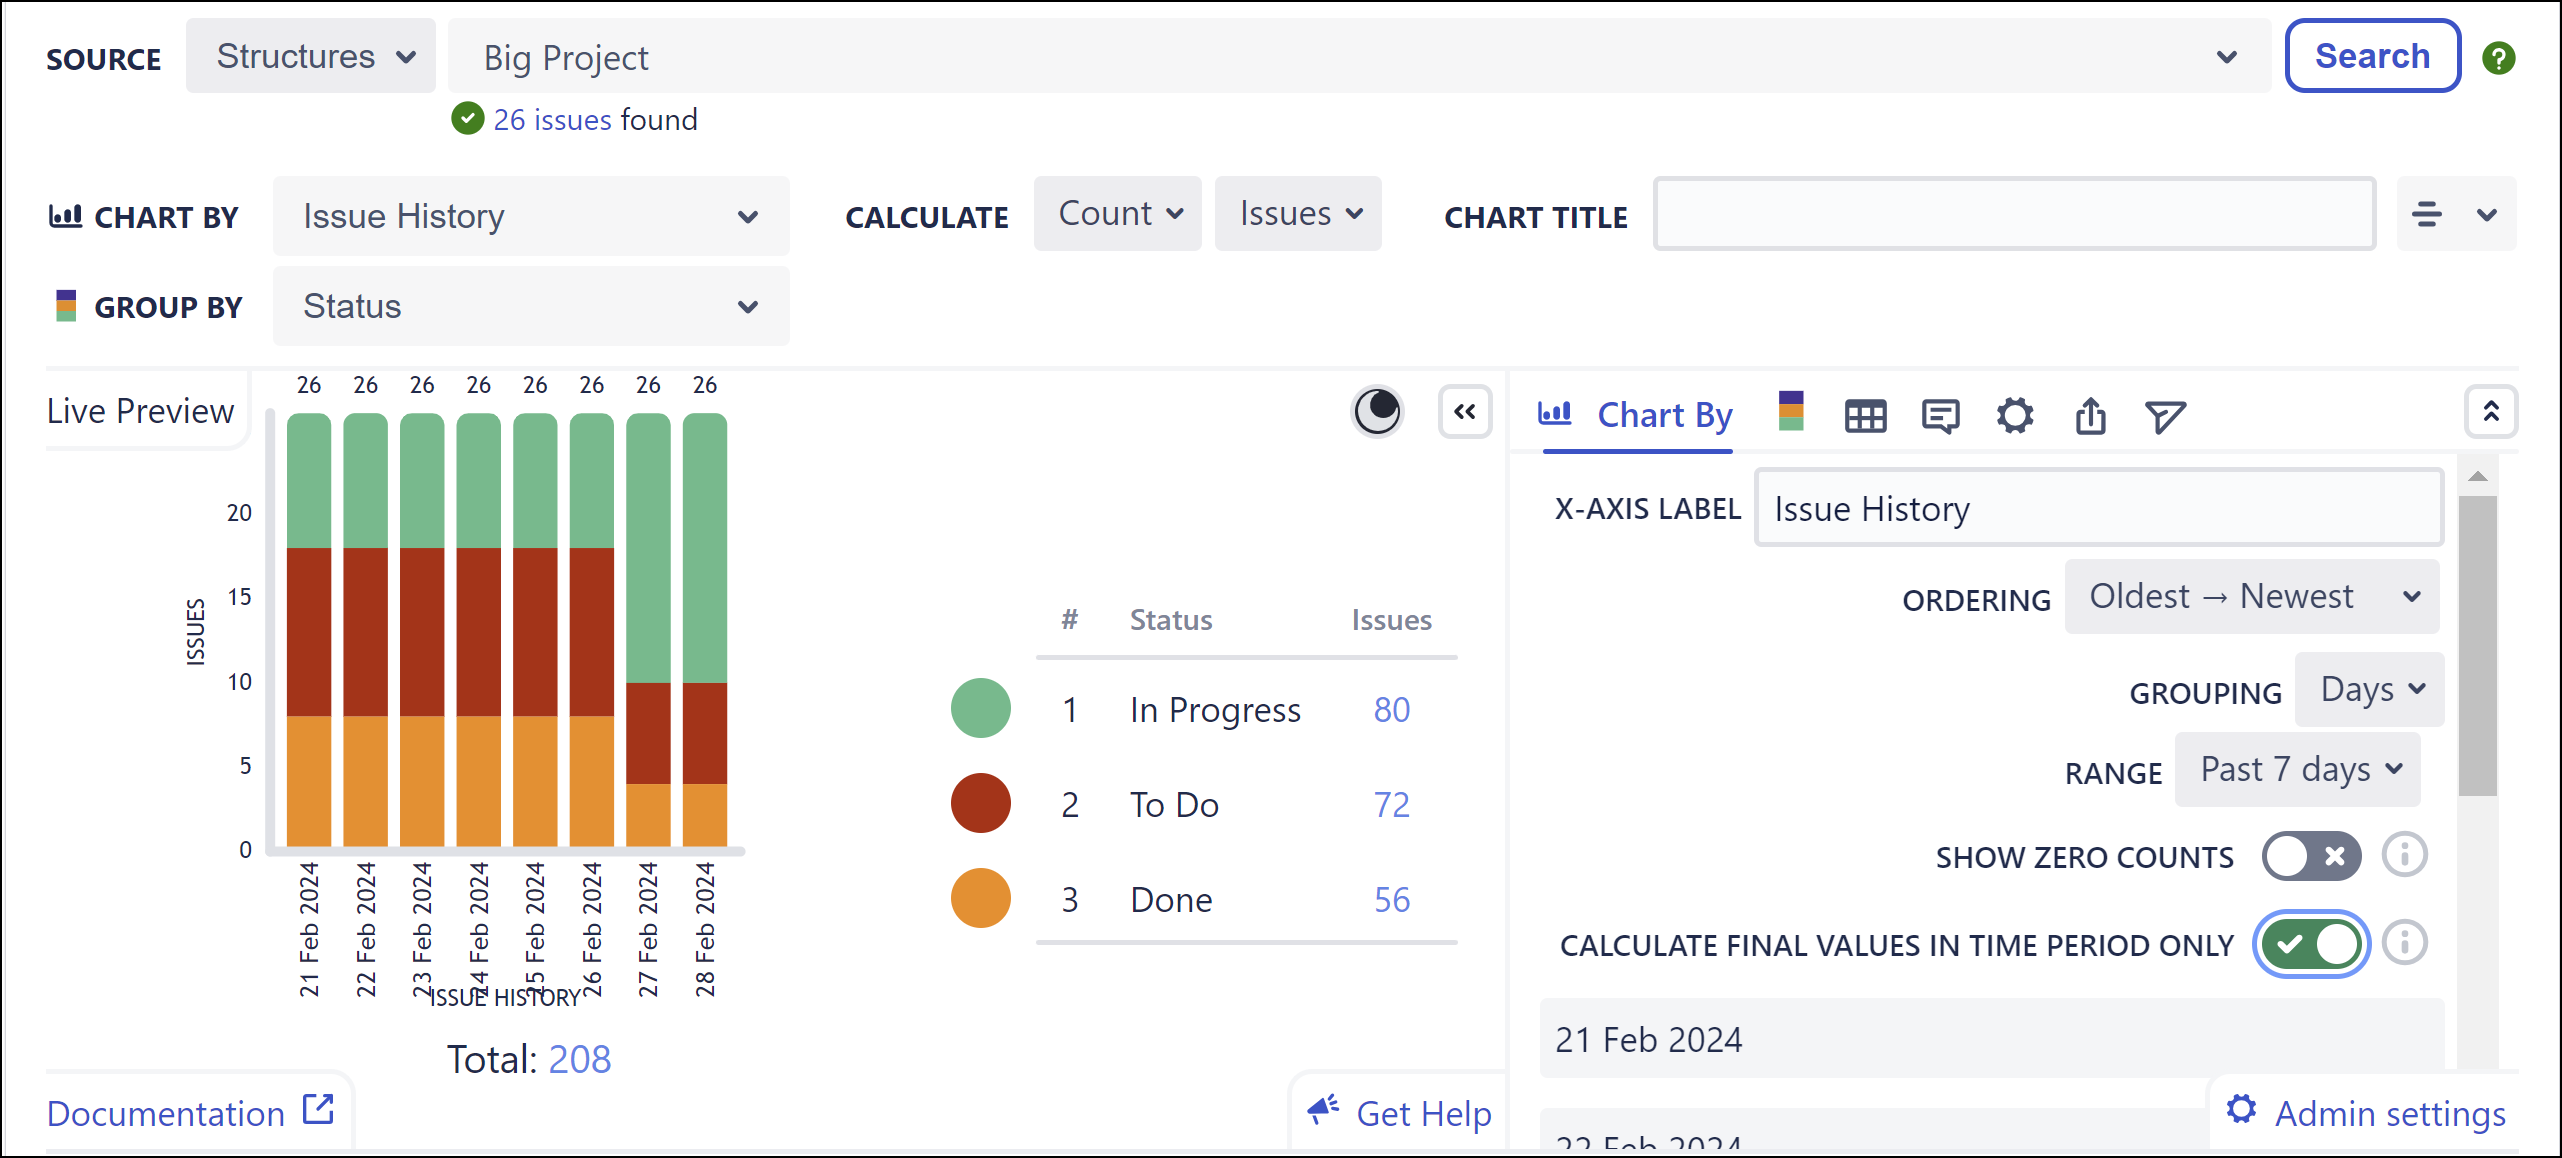
Configure the Custom Chart
Configure the chart with the following settings:
-
Type: 2D Stacked Bar Chart
-
Source: select Structure and search for your project structure
-
Chart by: Issue History
-
Group by: Status
-
In the Chart by tab, enable Calculate final values in time period only toggle
-
OPTIONAL: update the Grouping and Range settings to customize the appearance and dates for the chart
Need to add the chart to a Confluence page? Try Custom Charts for Confluence