Turn your curated Structure data into visual reports. Our integration with Custom Charts for Confluence allows you to easily add reports, charts, and graphs to a Confluence page, based on your structures.
-
Use Structure as the source for your Custom Charts
-
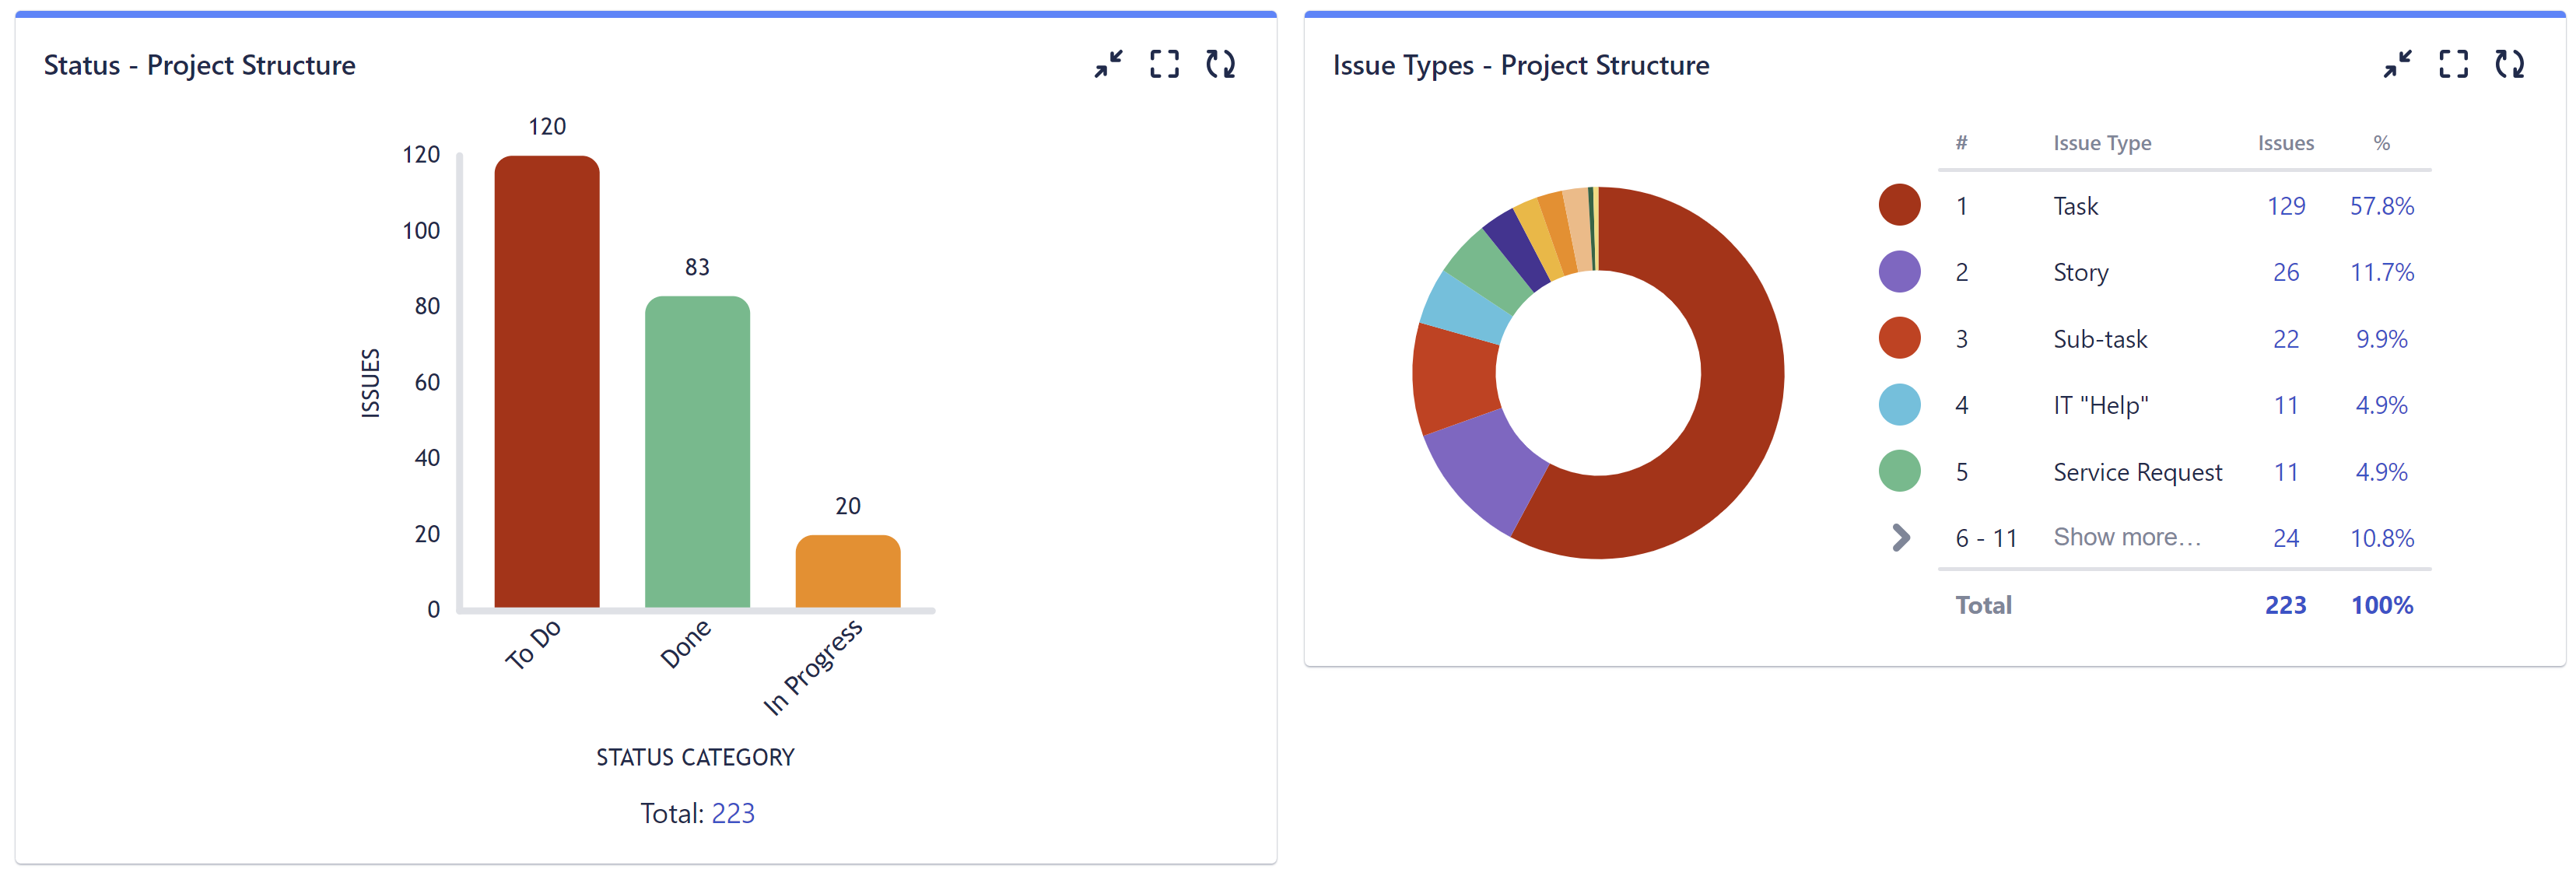
Turn Structure data into visual reports for stakeholders and leadership
-
Build custom reports for sprint progress, retrospectives, time in status, burndown , programs, customer satisfaction, workloads, age of work items, cumulative spend, and more
Don't have Custom Charts? Try it for free!
Build Custom Charts for a Structure
To build custom charts based on a structure:
-
Make sure Structure and Custom Charts for Confluence are installed
-
While editing a Confluence page, open the Macros menu (+) and search for "Custom Charts"
-
Select the first gadget from the list: Custom Jira Charts
-
In the newly created gadget, open the Source dropdown and select Structure
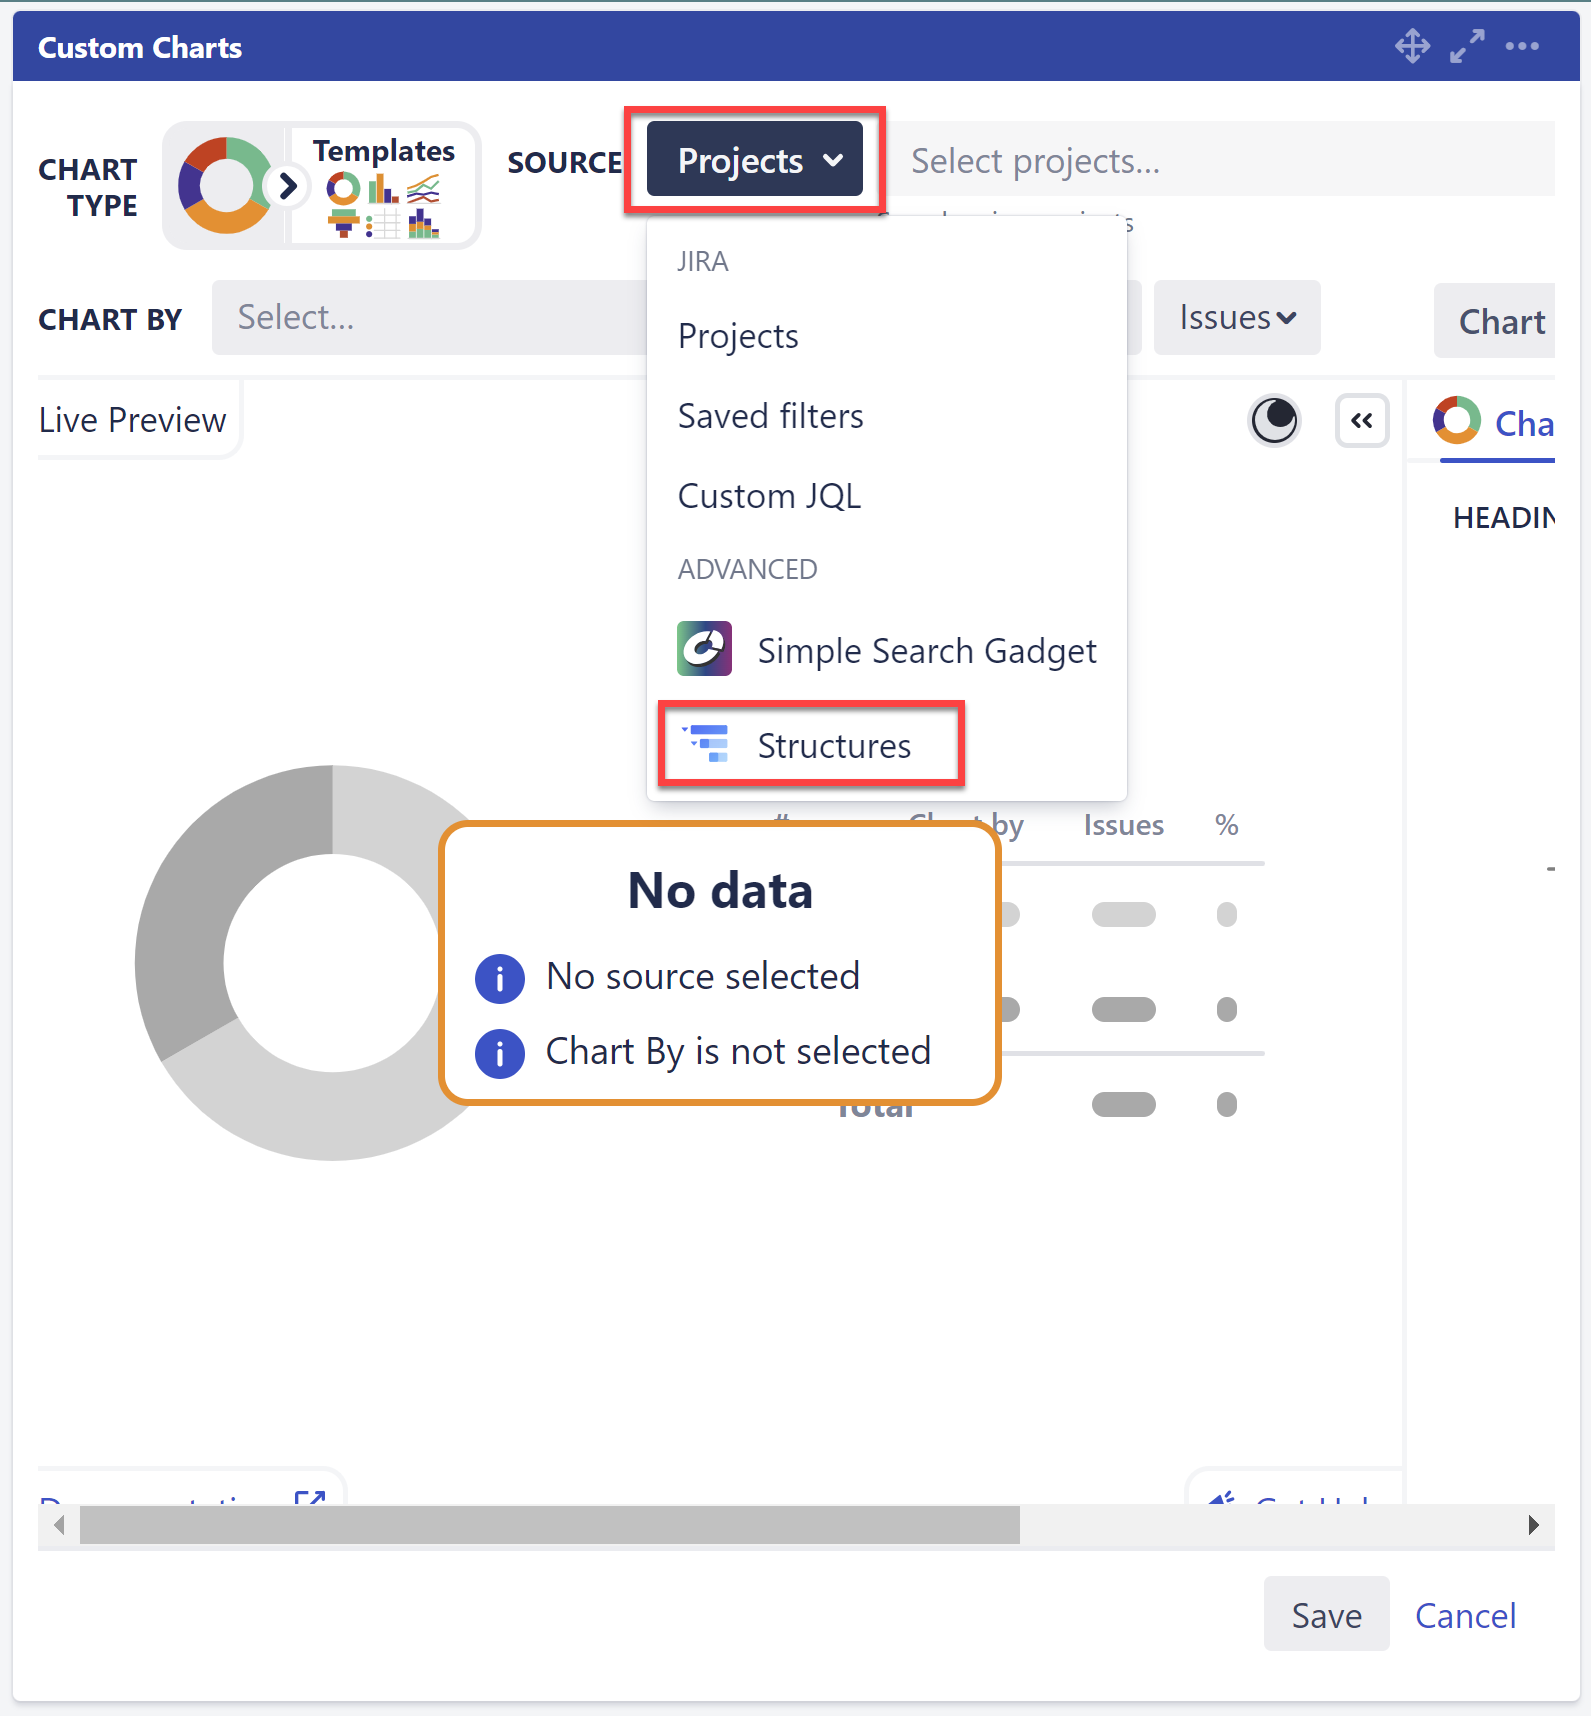
-
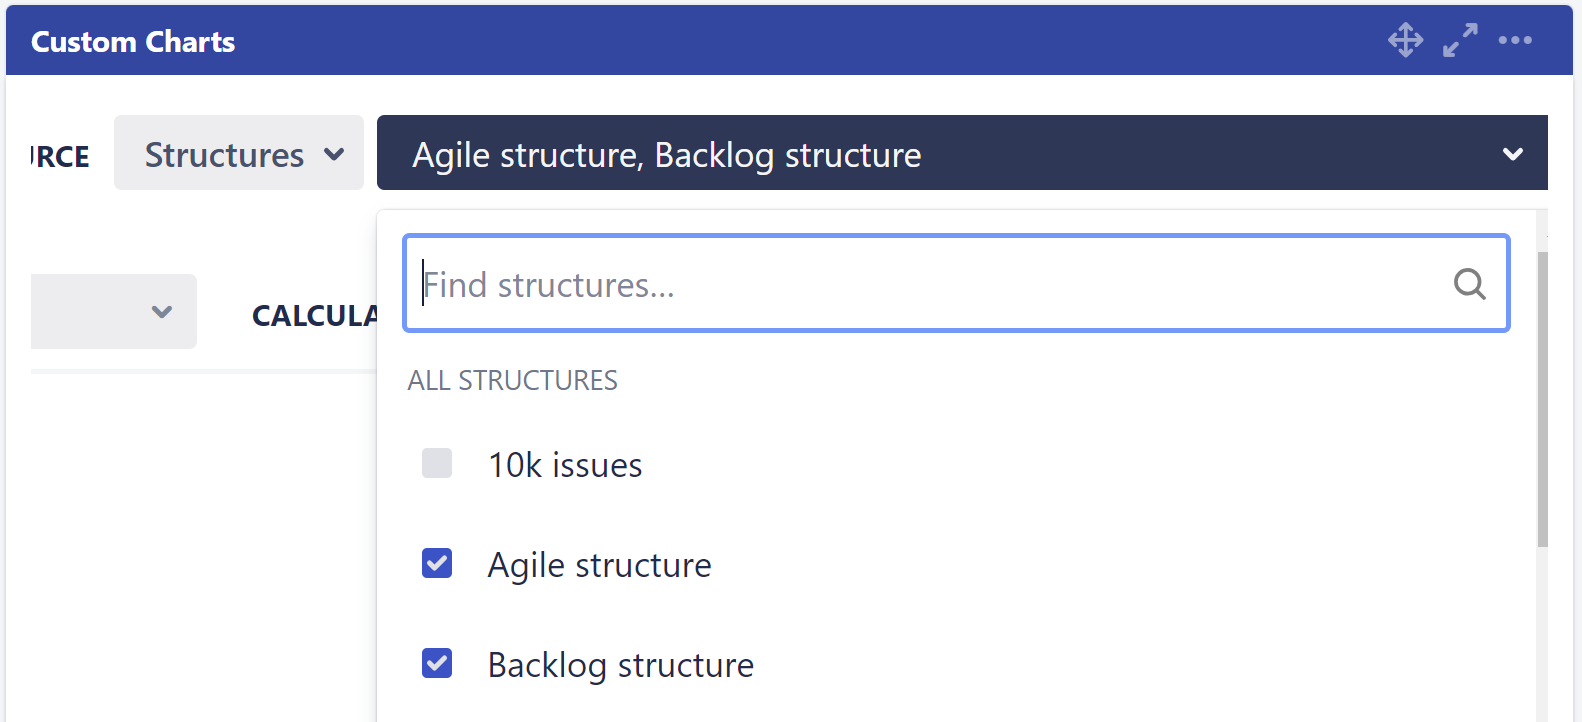
Select the structure or structures you want to use for your chart. The resulting chart will be based on all the work items in the selected structure(s).
-
Customize your chart.
For more information, view our Custom Charts documentation .
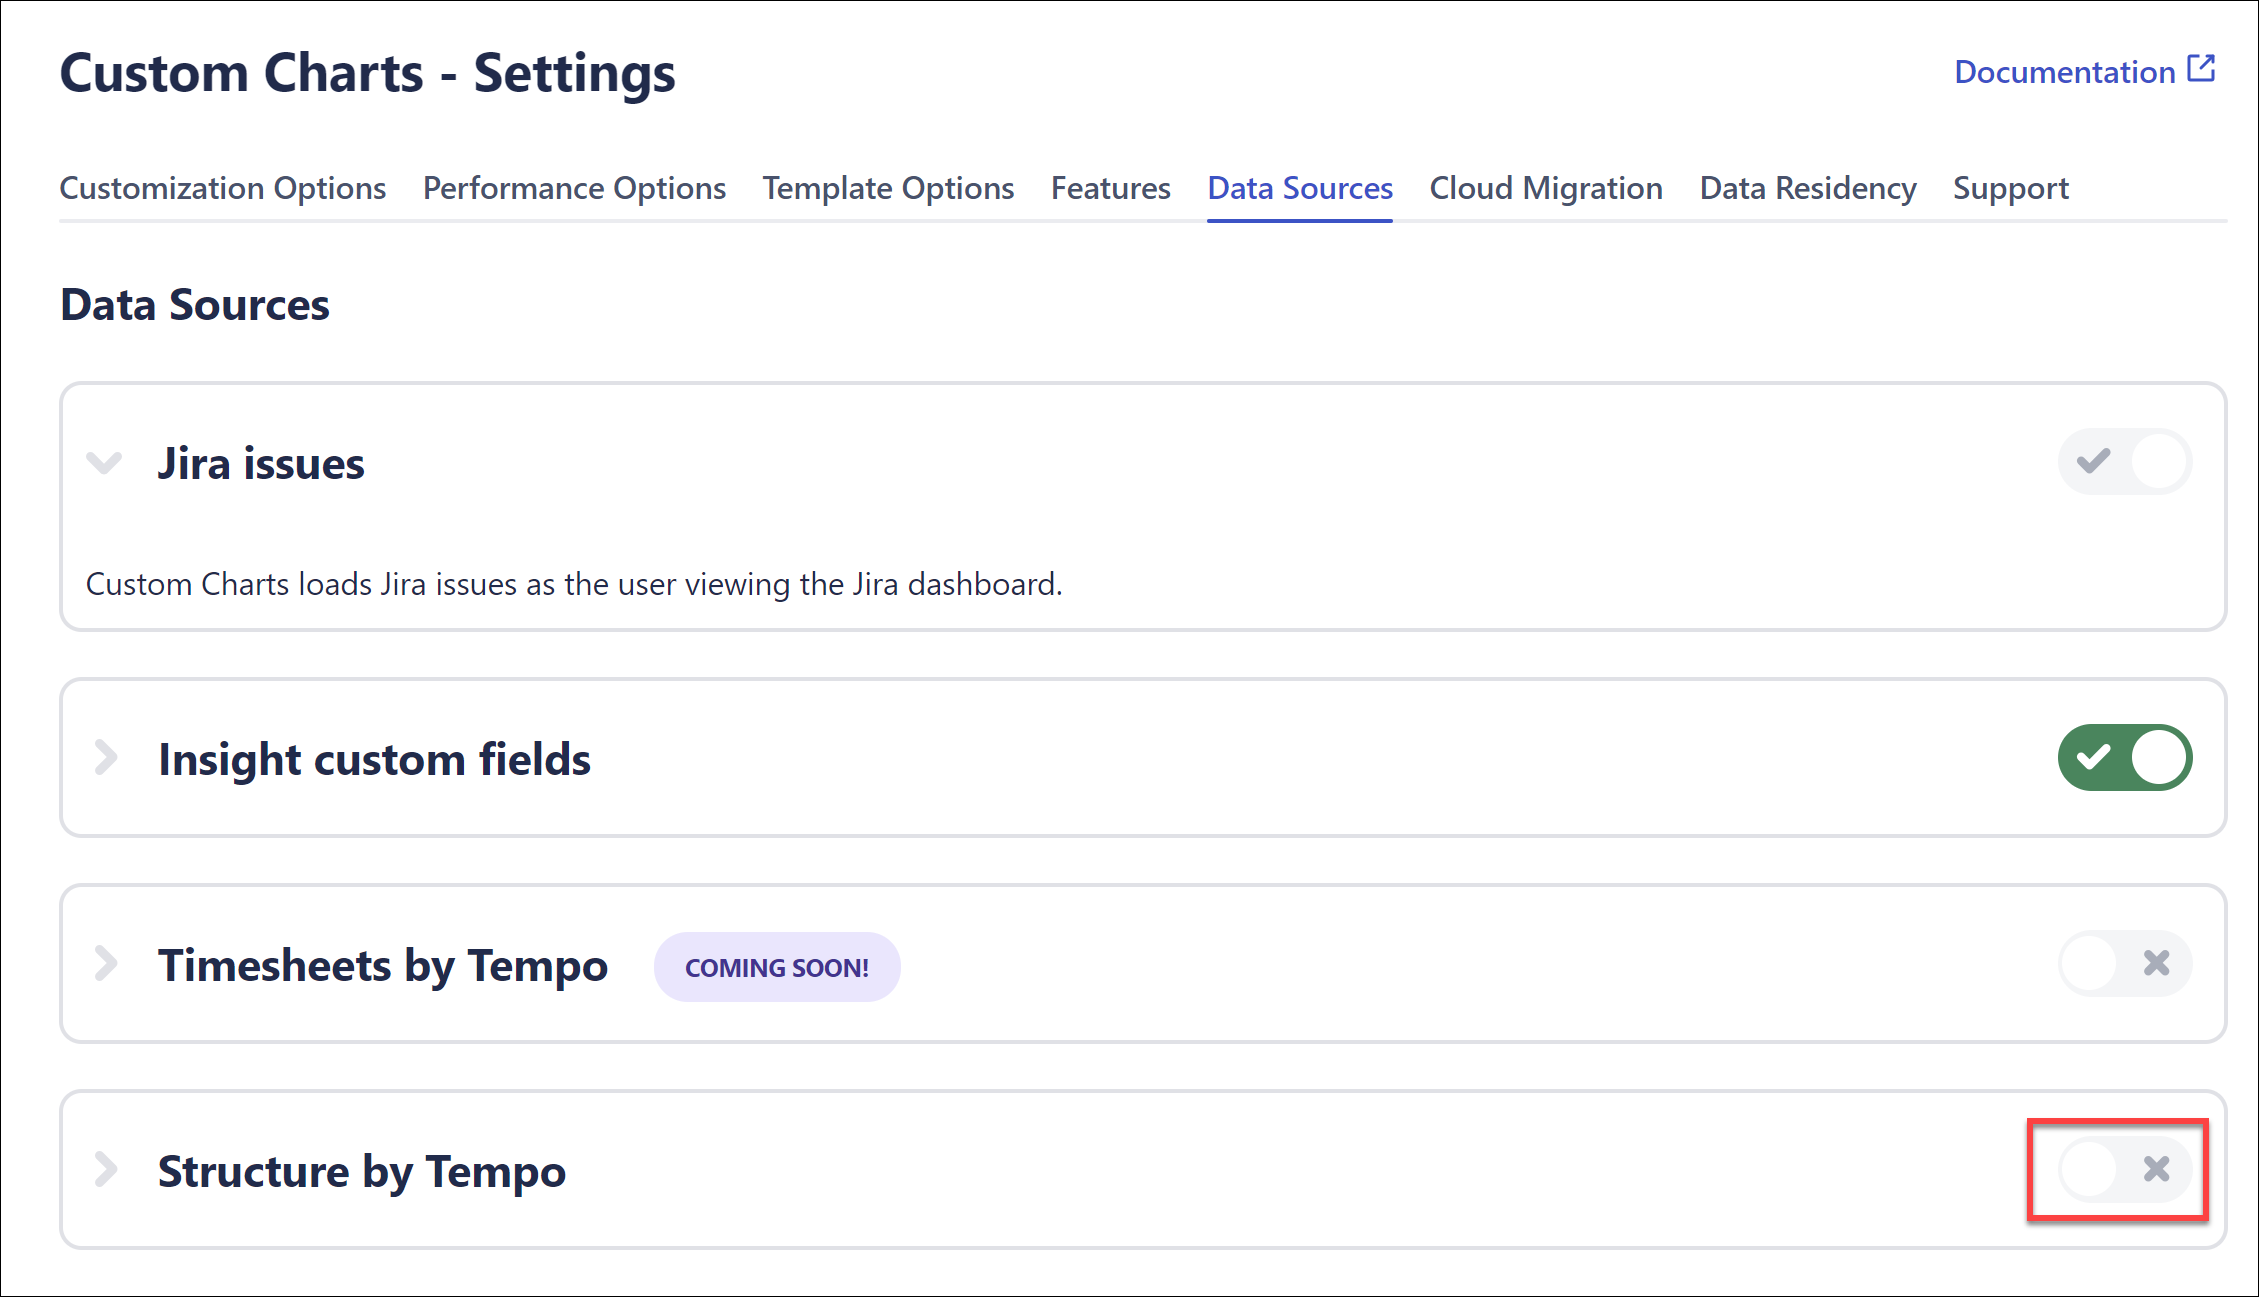
Enable Structure as a Data Source
If you aren't able to select Structure in the Source menu, ask your Confluence Admin to enable Structure as a data source for Custom Charts.
Admins: Go to Settings | Custom Jira Charts | Data Sources and enable Structure.